
ConceptDraw PRO ER Diagram Tool
Representing relationships between entities in Entity-Relationship diagrams in a way of structured flowchart, the best decision would be to make sure you illustrate the database correctly using different shapes, such as rectangles and ovals, for putting the entities’ names in and draw all the arrows as well in terms of connecting all of them. Our product ConceptDraw DIAGRAM allows you to create diagrams, including the entity-relationship one, in short terms using our solution called Entity-Relationship Diagram, so you can have it as a draft to be able to draw your own great professionally looking flowchart using our samples as simply basic for your work. To draw ERDs for different database systems is simpler than ever before, as our solution can be used to diagram ODBC-compatible databases, such as MS SQL, Oracle, InterBase, MS Access, MySQL, Firebird and many other to make sure it can be truly helpful in your work with any of them._Win_Mac.png)
Entity Relationship Diagram . Design Element — Crows Foot
Working as a software engineer making an abstract data model it is convenient to create them in ConceptDraw DIAGRAM application provided with a huge choice of examples of different diagram to simplify your work and to save your precious time. Using the Entity-Relationship Diagram (ERD) solution making the ER Diagrams created with Crow’s Foot notation can present you as a professional designer even if you are not that experienced yet. To illustrate the databases’ logical structure is obviously better with help of these diagrams that can be made in a short term looking really sophisticated. The most common shapes for Crow’s Foot notation are bars, circles and symbols which indicate various possibilities whether it’s many-to-one or many-to-many relationships. As a result, you can review, modify or convert the final diagram into many different formats such as PDF file, MS Visio, MS PowerPoint and many other graphic ones using ConceptDraw STORE which you can find here on our site. So the earlier you download the software with extension and start to use it the sooner you will succeed with your work!
Example of DFD for Online Store

Example of DFD for Online Store. Data Flow Diagram
Showing the connections between different components of same system you can make data flow diagram (DFD) to display the relationships and the interactions of different departments in the shop, for example. So making the DFD for the online store you have to mention all involved parties such as Administrator, Customer, Visitor, Manager, etc. To create this diagram can be much easier with help of the layouts from the libraries in the Solution Park here on this site or you can download the ConceptDraw STORE to have all the samples to your service. Using the existing examples from the libraries can simplify the work of drawing the needed flowcharts and diagrams for any kind of businesses. Data flow diagram, Gane-Sarson notation as well as Yourdon and Coad notation libraries contain all together 49 symbols you can use for making charts. You can find Data Flow Diagrams Solution in the Software Development area of ConceptDraw Solution Park on this site and start making your own project. Download ConceptDraw DIAGRAM now and enjoy using the sophisticated application for making your life easier!UML Deployment Diagram . Professional UML Drawing
UML deployment diagram - Real estate transactionsEntity Relationship Diagram Symbols

Entity Relationship Diagram Symbols. Professional ERD Drawing
Very commonly used in the database structure design, the sematic modelling method is one the ways of describing data structures as well as its modelling, based on the meaning of this data. ER-model based diagrams (ERD) consist of these main components: relation, entity and attributes. To be able to create such diagram, you have to mention the entities with their names presented in a form of a rectangle and the relations in a way of non-directional line connecting two entities. To help you to create this chart, we developed ConceptDraw STORE product full of libraries with vector elements you can use for your flowchart. Also we provide you with Solutions section on this site where you can find the numerous stencil libraries, samples and examples to simplify your work with software called ConceptDraw DIAGRAM which is the only one offering that many symbols and templates for making professionally looking smart and mature diagrams.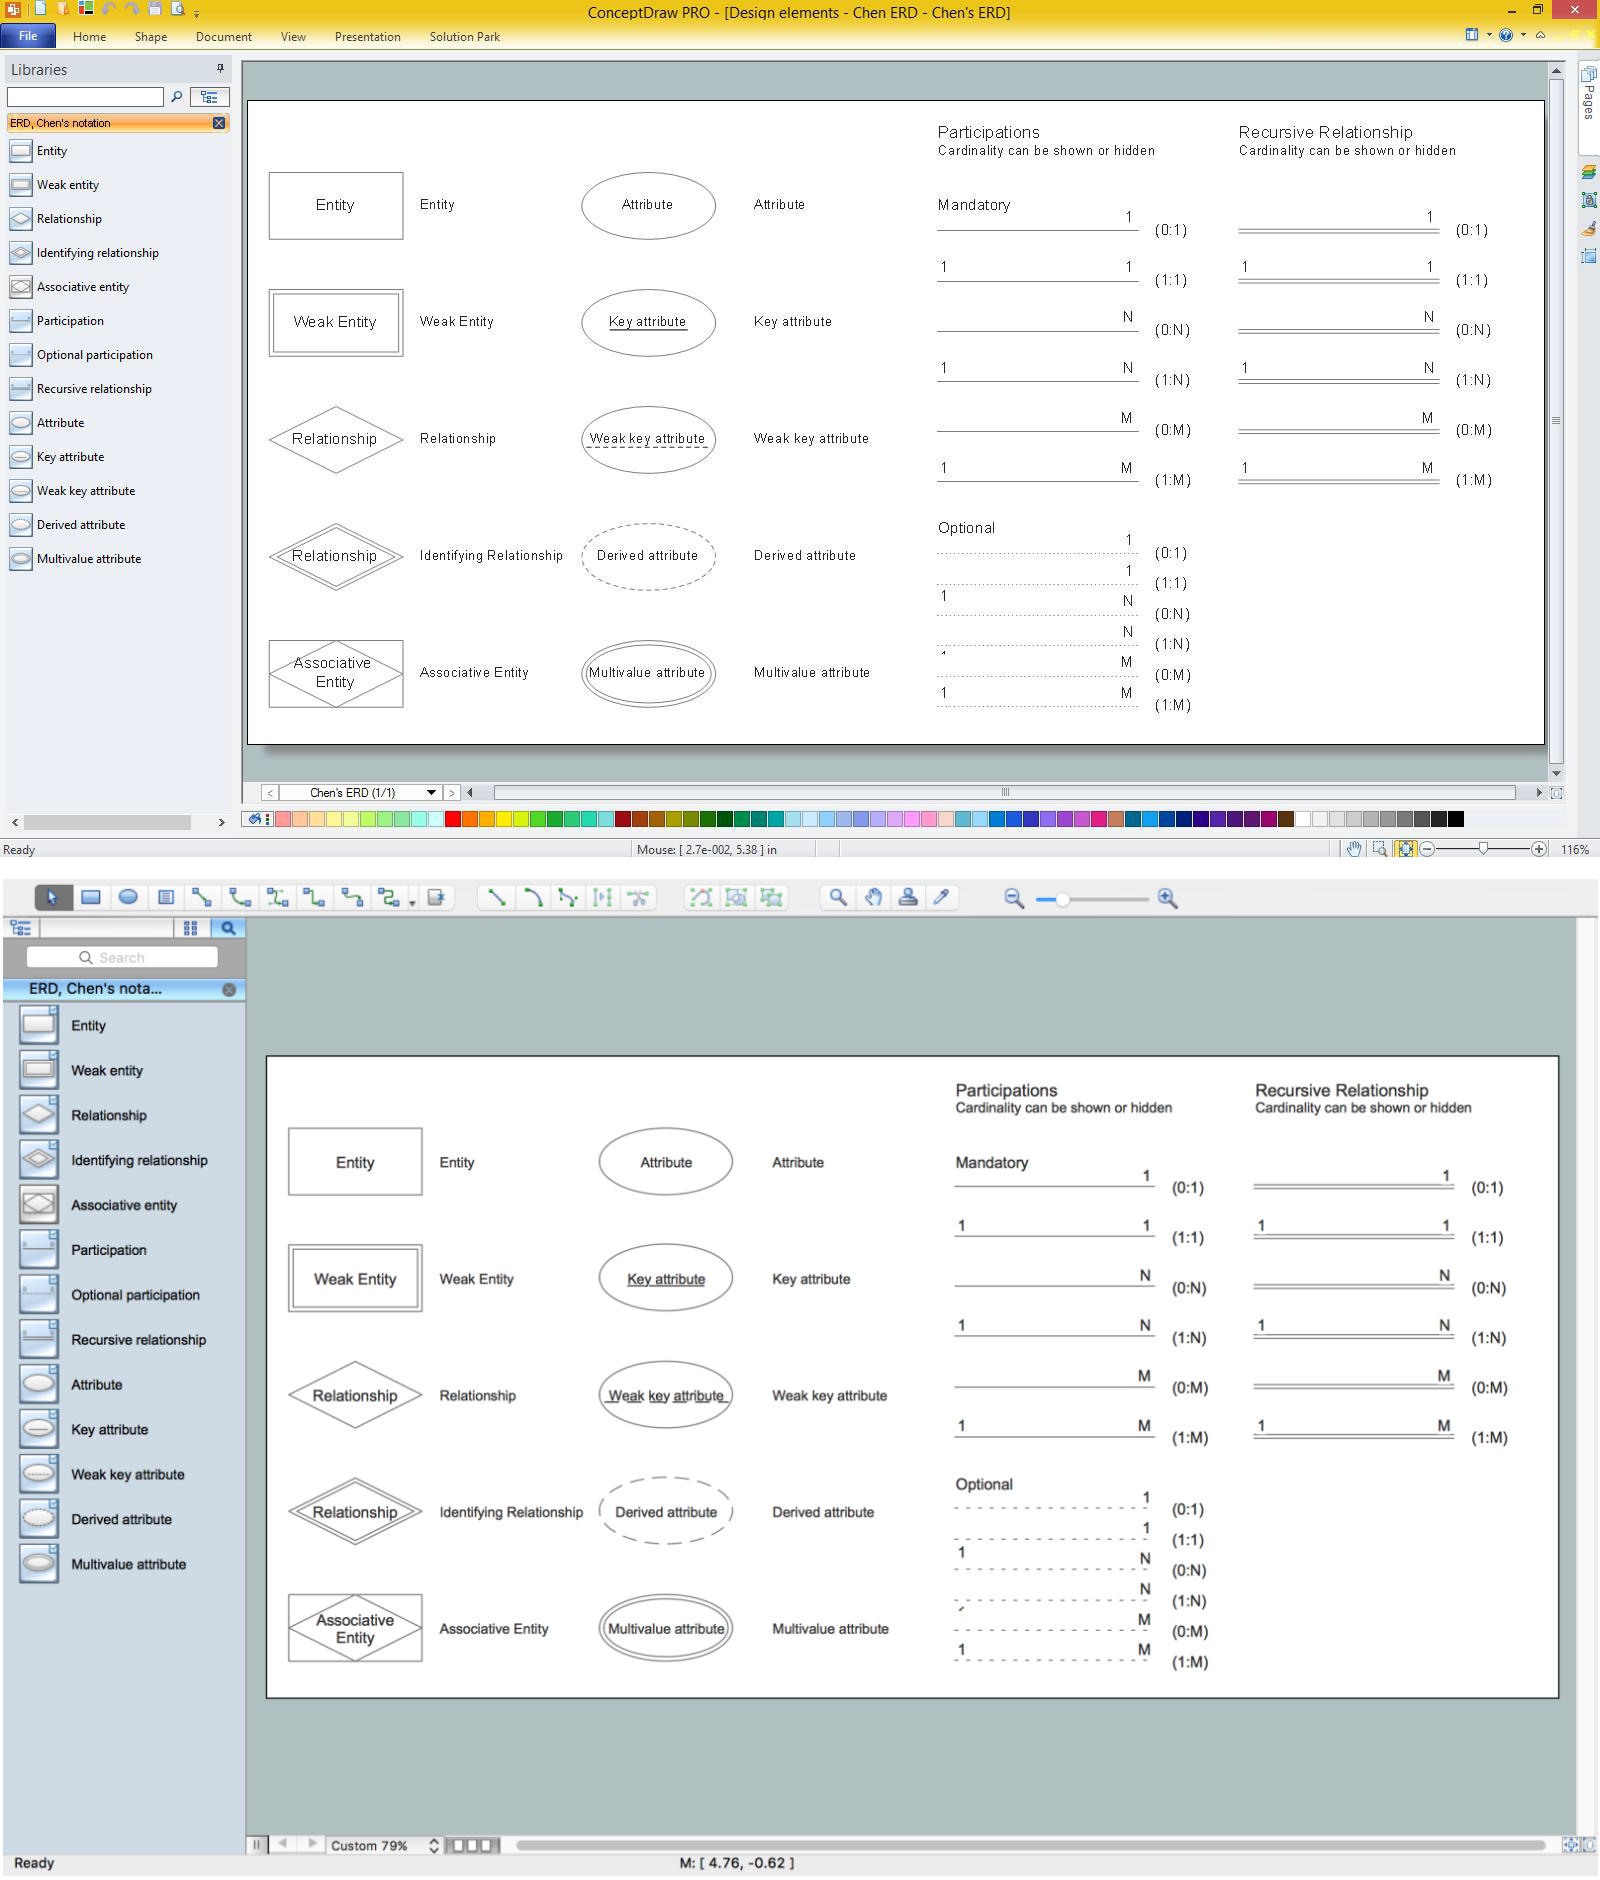
Design Element: Chen. Professional ERD Drawing
Entity-relationship diagrams or ERD are very well known for representing some data models as well as the relationships and the connections between them. Chen notation was first introduced by Chen and then developed by Barker and it provides lots of data modelling tool as, for example, decomposition charts or attribute diagrams as well as entity-relationship diagrams. The name of the diagram itself explains the reason of creating such type of diagram as it shows the relationship between the different entities which are the real or sometimes abstract objects, such as ideas, people, events, items, conditions, etc. Having ConceptDraw DIAGRAM on your desktop means having lots of design elements for creating any flowchart, charts, diagrams, schemes or plans with help of lots of templates as well as different examples of already existing diagrams, including the ERD. Downloading this application means helping yourself in drawing anything you need in a very short term and having the final result looking very professional.
 Entity Relationship Diagram ( ERD ) Solution. ConceptDraw.com
An Entity-Relationship Diagram ( ERD ) is a visual presentation of entities and
relationships. Free Solutions. 126 . Creating similar diagrams in
ConceptDraw PRO will take just minutes. ( ERD ) solution can be purchased
either from the Software Development area of ConceptDraw STORE itself or from
our online store.


Design Element: Crows Foot. Professional ERD Drawing
It may sound very complex, but for those who work with it, especially in IT business, entity-relationship diagram is a very usual thing that can be used for executing the specification of some data warehouse for any designed system and for documenting all of the entities in system as well as their interactions with each other including the important domain objects or entities identification and the properties of these objects which are called the attributes. Also you can make ERD for visualizing relationships of these attributes to some other objects no matter what these objects are. To sum up, ER Diagrams of Crow’s Foot as well as Chen notations can help you to make the chart which consists of elements that are meant to describe each of the system’s element and to make such diagram is better in ConceptDraw DIAGRAM as it is the only one that professional software.- Online Erd Maker
- Top 5 Android Flow Chart Apps | Free Online Diagram Software
- Free Online Diagram Maker
- Online Erd Tool
- Online Diagram Tool | Flow Chart Online | Free Sentence ...
- Online Er Diagram Generator
- Free Online Er Diagram
- Free Online Sentence Diagramming Tool
- Er Diagram Tools Online
- Online Entity Relationship Diagram Creator