 Event-driven Process Chain Diagrams
Event-Driven Process Chain Diagrams solution extends ConceptDraw DIAGRAM functionality with event driven process chain templates, samples of EPC engineering and modeling the business processes, and a vector shape library for drawing the EPC diagrams and EPC flowcharts of any complexity. It is one of EPC IT solutions that assist the marketing experts, business specialists, engineers, educators and researchers in resources planning and improving the business processes using the EPC flowchart or EPC diagram. Use the EPC solutions tools to construct the chain of events and functions, to illustrate the structure of a business process control flow, to describe people and tasks for execution the business processes, to identify the inefficient businesses processes and measures required to make them efficient.
IDEF3 Standard

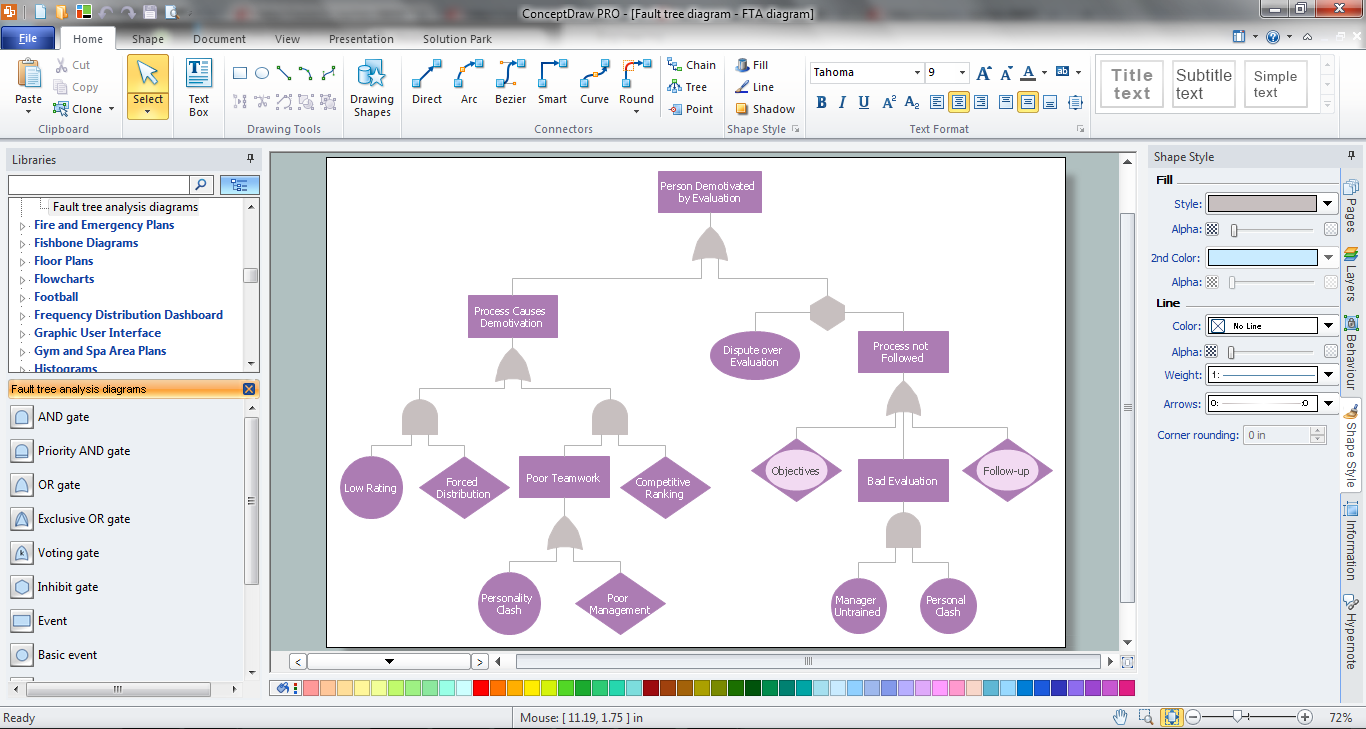
The vector stencils library "Fault tree analysis diagrams" contains 12 symbols for drawing FTA diagrams in the ConceptDraw PRO diagramming and vector drawing software extended with the Fault Tree Analysis Diagrams solution from the Engineering area of ConceptDraw Solution Park.
www.conceptdraw.com/ solution-park/ engineering-fault-tree-analysis-diagrams
www.conceptdraw.com/ solution-park/ engineering-fault-tree-analysis-diagrams
AND gate

Priority AND gate

OR gate

Inhibit gate

XOR gate

Event

Basic event

Undeveloped event

House event

Conditional event

Transfer symbol

Voting gate

HelpDesk
How to Create a Fault Tree Analysis Diagram (FTD)

The vector stencils library "Fault tree analysis diagrams" contains 12 symbols for drawing FTA diagrams in the ConceptDraw PRO diagramming and vector drawing software extended with the Fault Tree Analysis Diagrams solution from the Engineering area of ConceptDraw Solution Park.
www.conceptdraw.com/ solution-park/ engineering-fault-tree-analysis-diagrams
www.conceptdraw.com/ solution-park/ engineering-fault-tree-analysis-diagrams
AND gate
Priority AND gate
OR gate
Inhibit gate
XOR gate
Event
Basic event
Undeveloped event
House event
Conditional event
Transfer symbol
Voting gate
Fault Tree Analysis Software
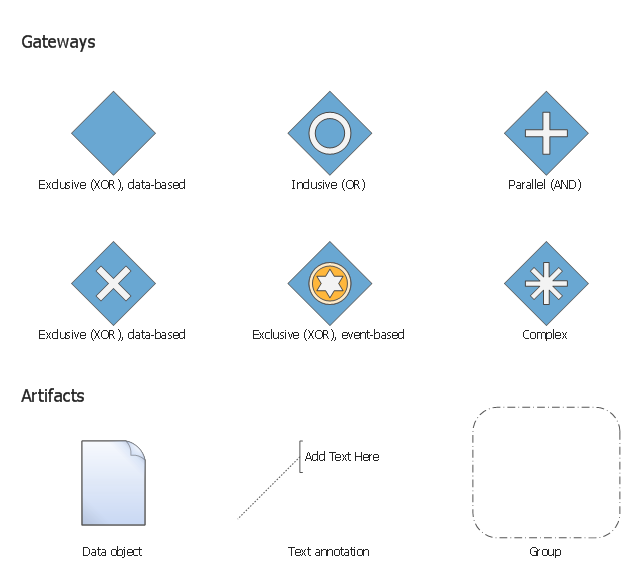
The vector stencils library "Gateways BPMN 1.2" contains symbols: data-based and event-based exclusive (XOR), inclusive (OR), parallel (AND), complex.
The vector stencils library "Artifacts BPMN 1.2" contains symbols: data object, text annotation, and group.
Use these shapes for creating the business process diagrams using the ConceptDraw PRO diagramming and vector drawing software.
"Gateway.
A gateway is represented with a diamond shape and determines forking and merging of paths, depending on the conditions expressed.
Exclusive.
Used to create alternative flows in a process because only one of the paths can be taken, it is called exclusive.
Event Based.
The condition determining the path of a process is based on an evaluated event.
Parallel.
Used to create parallel paths without evaluating any conditions.
Inclusive.
Used to create alternative flows where all paths are evaluated.
Exclusive Event Based.
An event is being evaluated to determine which of mutually exclusive paths will be taken.
Complex.
Used to model complex synchronization behavior.
Parallel Event Based.
Two parallel process are started based on an event but there is no evaluation of the event. ...
Artifacts allow developers to bring some more information into the model/ diagram. In this way the model/ diagram becomes more readable. There are three pre-defined Artifacts and they are:
(1) Data objects: Data objects show the reader which data is required or produced in an activity.
(2) Group: A Group is represented with a rounded-corner rectangle and dashed lines. The group is used to group different activities but does not affect the flow in the diagram.
(3) Annotation: An annotation is used to give the reader of the model/ diagram an understandable impression." [Business Process Model and Notation. Wikipedia]
The example "Design elements - Gateways and artifacts BPMN 1.2" is included in the Business Process Diagram solution from the Business Processes area of ConceptDraw Solution Park.
BPMN 1.2 gateway and artifact symbols
Types of Flowcharts


ERD Symbols and Meanings


This vector stencils library contains 12 process schematic symbols.
Use it to design your IDEF3 diagrams with ConceptDraw PRO diagramming and vector drawing tools.
The vector stencils library "IDEF3 process schematic symbols" is included in the IDEF Business Process Diagrams solution from the Business Processes area of ConceptDraw Solution Park.
Use it to design your IDEF3 diagrams with ConceptDraw PRO diagramming and vector drawing tools.
The vector stencils library "IDEF3 process schematic symbols" is included in the IDEF Business Process Diagrams solution from the Business Processes area of ConceptDraw Solution Park.
Unit of Behavior (UOB)
-vector-stencils-library---idef3-process-schematic-symbols.png--diagram-flowchart-example.png)
Simple Precedence Link

General Constraint Precedence Link

Direction Constraint Precedence Link

Opposite Direction Constraint Precedence Link
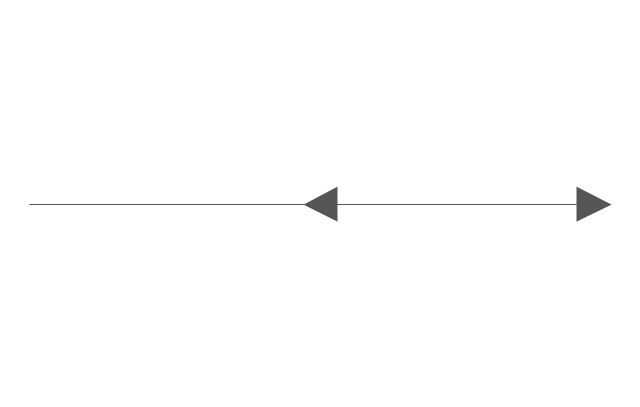
Both Directions Constraint Precedence Link

Relational Link

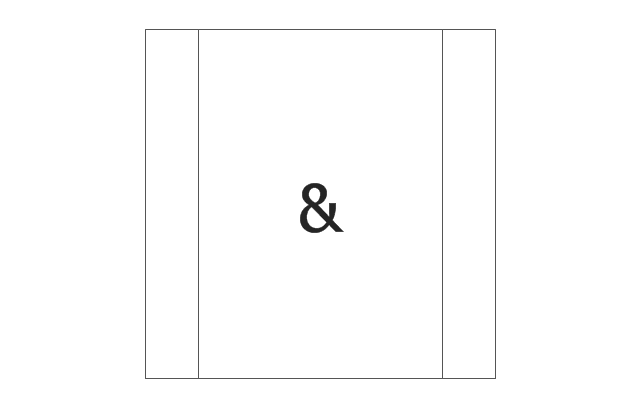
AND Junction (process)
-vector-stencils-library---idef3-process-schematic-symbols.png--diagram-flowchart-example.png)
OR Junction (process)
-vector-stencils-library---idef3-process-schematic-symbols.png--diagram-flowchart-example.png)
Synchronous AND Junction
Synchronous OR Junction

XOR Junction
- Types of Flowcharts | How to Create a Fault Tree Analysis Diagram ...
- IDEF3 Standard | Event-driven Process Chain Diagrams | Business ...
- Swimlane Diagramm Xor
- Xor
- Bpmn 2 0 Xor Gateway Alternative
- Fault tree analysis diagrams - Vector stencils library
- Types of Flowcharts | Xor Indicator In Flowchart
- Fault tree analysis diagrams - Vector stencils library
- Bpmn Diagram Gateways Vector Stencils