 ConceptDraw Solution Park
ConceptDraw Solution Park collects graphic extensions, examples and learning materials
HelpDesk
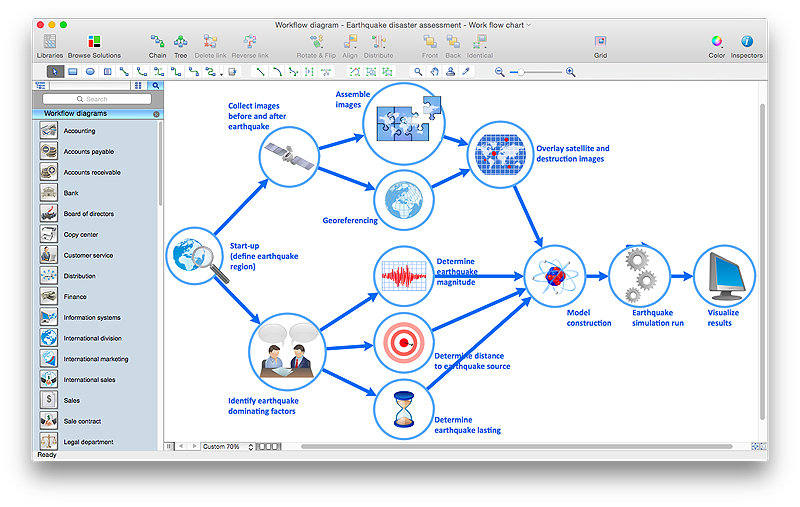
How to Create a Workflow Diagram Using ConceptDraw Solution Park
A workflow diagram is a specialized type of flowchart. With the help of a workflow diagram you can visually describe the tasks, documents, people responsible for execution at each stage of workflow. The ability to create Workflow diagrams is contained in the ConceptDraw Workflow Diagrams solution.Process Flowchart
The main reason of using Process Flowchart or PFD is to show relations between major parts of the system. Process Flowcharts are used in process engineering and chemical industry where there is a requirement of depicting relationships between major components only and not include minor parts. Process Flowcharts for single unit or multiple units differ in their structure and implementation. ConceptDraw PRO is Professional business process mapping software for making Process flowcharts, Process flow diagram, Workflow diagram, flowcharts and technical illustrations for business documents and also comprehensive visio for mac application. Easier define and document basic work and data flows, financial, production and quality management processes to increase efficiency of your business with ConcepDraw PRO. Business process mapping software with Flowchart Maker ConceptDraw PRO includes extensive drawing tools, rich examples and templates, process flowchart symbols and shape libraries, smart connectors that allow you create the flowcharts of complex processes, process flow diagrams, procedures and information exchange. Process Flowchart Solution is project management workflow tools which is part ConceptDraw Project marketing project management software. Drawing charts, diagrams, and network layouts has long been the monopoly of Microsoft Visio, making Mac users to struggle when needing such visio alternative like visio for mac, it requires only to view features, make a minor edit to, or print a diagram or chart. Thankfully to MS Visio alternative like ConceptDraw PRO software, this is cross-platform charting and business process management tool, now visio alternative for making sort of visio diagram is not a problem anymore however many people still name it business process visio tools.
 Workflow Diagrams
Workflow Diagrams solution extends ConceptDraw PRO software with samples, templates and vector stencils library for drawing the work process flowcharts.
 Comparison Dashboard
Comparison dashboard solution extends ConceptDraw PRO software with samples, templates and vector stencils library with charts and indicators for drawing the visual dashboard comparing data.
HelpDesk
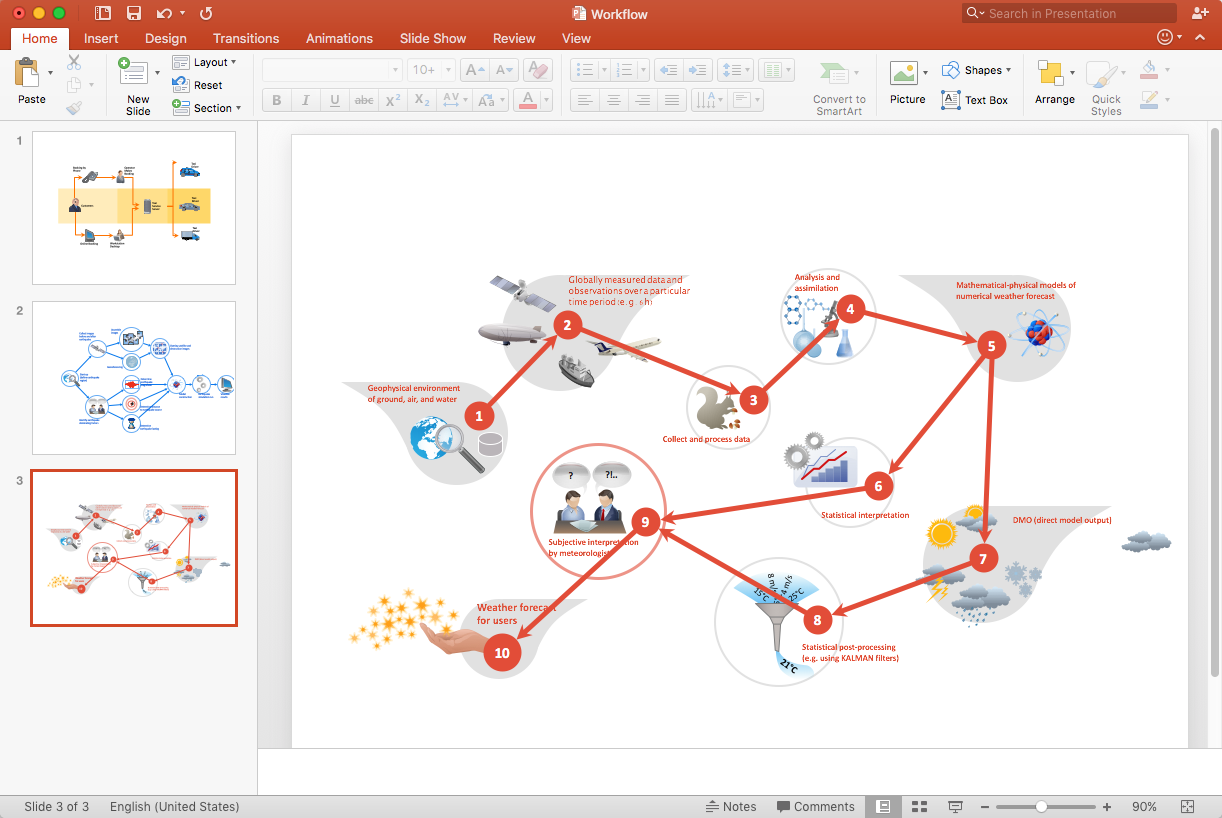
How to Add a Workflow Diagram to a PowerPoint Presentation
Making workflow diagrams in PowerPoint can help to describe the process within your organization as well as making comprehensive analysis presentations for sales or management and also can be used in other presentations and business documentation.Business diagrams & Org Charts with ConceptDraw PRO
The business diagrams are in great demand, they describe the business processes, business tasks and activities which are executed to achieve specific organizational and business goals, increase productivity, reduce costs and errors. They let research and better understand the business processes. ConceptDraw PRO is a powerful professional cross-platform business graphics and business flowcharting tool which contains hundreds of built-in collections of task-specific vector stencils and templates. They will help you to visualize and structure information, create various Business flowcharts, maps and diagrams with minimal efforts, and add them to your documents and presentations to make them successful. Among them are Data flow diagrams, Organization charts, Business process workflow diagrams, Audit flowcharts, Cause and Effect diagrams, IDEF business process diagrams, Cross-functional flowcharts, PERT charts, Timeline diagrams, Calendars, Marketing diagrams, Pyramids, Target diagrams, Venn diagrams, Comparison charts, Analysis charts, Dashboards, and many more. Being a cross-platform application, ConceptDraw PRO is very secure, handy, free of bloatware and one of the best alternatives to Visio for Mac users.
HelpDesk
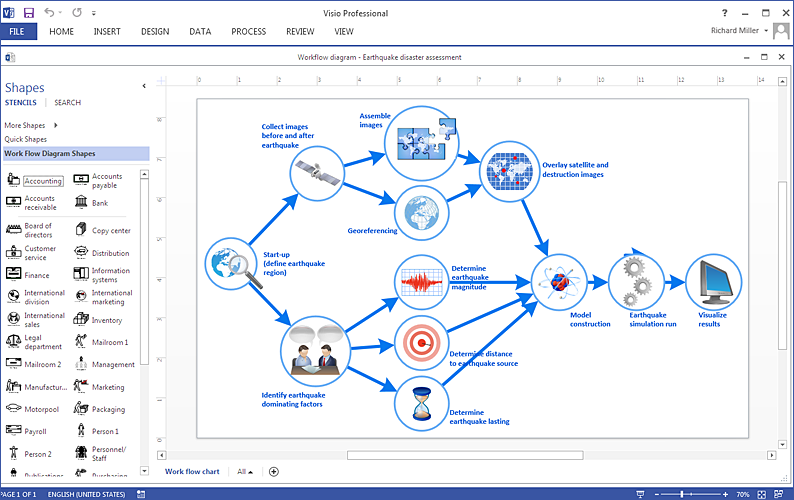
How To Create a MS Visio Workflow Diagram
A workflow diagram shows a working process as a set of related events that follow each other in a particular order.They are usually created as flowcharts, with shapes that represent steps in the process connected by arrows that indicate the next step. Making a business process diagram involves many elements that can be managed using ConceptDraw PRO. The ability to design workflow diagrams is delivered by the Workflow Diagrams solution. ConceptDraw PRO allows you to easily create workflow diagrams and then make a MS Visio file from your diagrams. Using ConceptDraw PRO, you can export your workflow diagrams to MS Visio VSDX and VDX files.Basic Flowchart Symbols and Meaning
Flowcharts are the best for visually representation the business processes and the flow of a custom-order process through various departments within an organization. ConceptDraw PRO diagramming and vector drawing software extended with Flowcharts solution offers the full set of predesigned basic flowchart symbols which are gathered at two libraries: Flowchart and Flowcharts Rapid Draw. Among them are: process, terminator, decision, data, document, display, manual loop, and many other specific symbols. The meaning for each symbol offered by ConceptDraw gives the presentation about their proposed use in professional Flowcharts for business and technical processes, software algorithms, well-developed structures of web sites, Workflow diagrams, Process flow diagram and correlation in developing on-line instructional projects or business process system. Use of ready flow chart symbols in diagrams is incredibly useful - you need simply drag desired from the libraries to your document and arrange them in required order. There are a few serious alternatives to Visio for Mac, one of them is ConceptDraw PRO. It is one of the main contender with the most similar features and capabilities.
HelpDesk
How to Create SWOT Analysis Template Using ConceptDraw PRO
SWOT-analysis is used to develop a marketing strategy. SWOT-analysis includes determining the strengths and weaknesses in the company's activity, potential external threats and opportunities and assesses their relative strategic competitors. ConceptDraw SWOT and TOWS Matrix Diagrams solution provide a set of SWOT matrix in which should be recorded and then compared the strengths and weaknesses of the enterprise and the market opportunities and threats. This comparison allows you to determine what steps can be taken for the development of your company and what problems need to be addressed urgently.HelpDesk
How to Make a Workflow Diagram Using ConceptDraw PRO
With the help of a workflow diagram you can visually describe the tasks, documents, people responsible for execution at each stage of workflow. Modern workflow diagrams have a specific focus on quality control. This can apply to the quality of inputs and outputs related to a process, or to the actual efficiency of the workflow itself. Different sectors of business use different diagramming techniques, and this has given rise to a number of methods that have become recognized in their own right as industry standards. ConceptDraw PRO, with the Workflow Diagrams solution, is ideal for creating diagrams of this type. Its RapidDraw technology takes the strain from diagram arrangement, allowing users to create their process steps with a single click, ideal for generating the many repeatable tasks that can make up a workflow. The Workflow Diagrams solution complements this feature with a library of selected icons to represent various steps.HelpDesk
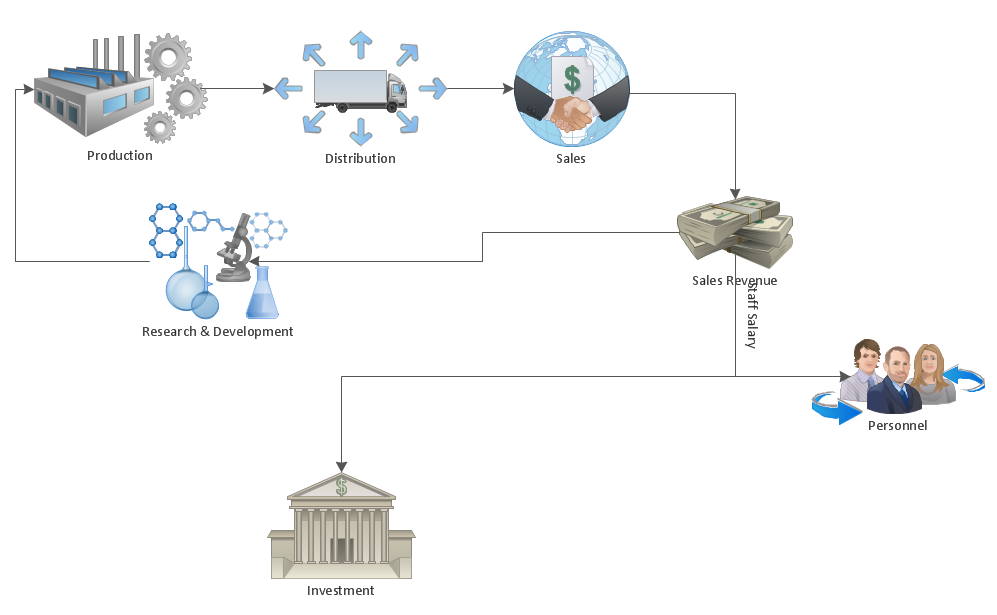
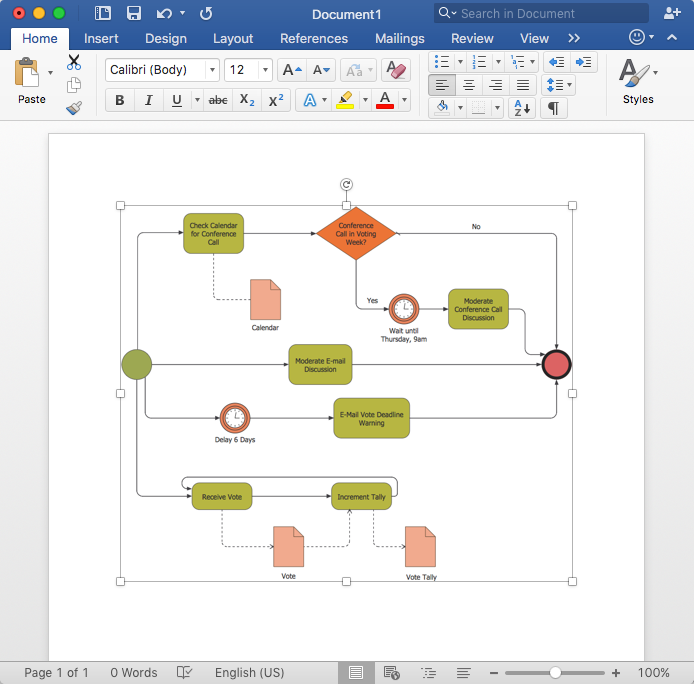
How to Add a Business Process Diagram to MS Word Document
ConceptDraw PRO allows you to easily create business process diagrams and then add them to a MS Word document.Pie Chart Software
A pie chart is a circular diagram showing a set of data divided into proportional slices. There are several variations of this chart such as donut chart, exploded pie chart, multi-level pie charts. Although it is not very informative when a ring chart or circle chart has many sections, so choosing a low number of data points is quite important for a useful pie chart. ConceptDraw PRO software with Pie Charts solution helps to create pie and donut charts for effective displaying proportions in statistics, business and mass media for composition comparison, i.e. for visualization of part percentage inside one total.
 Sales Flowcharts
The Sales Flowcharts solution lets you create and display sales process maps, sales process workflows, sales steps, the sales process, and anything else involving sales process management.
- How to Draw a Pictorial Chart in ConceptDraw PRO | Sample ...
- Comparison Dashboard | ConceptDraw Solution Park | Office Layout ...
- Financial Comparison Chart | How to Create a Bar Chart in ...
- How to Draw a Pictorial Chart in ConceptDraw PRO | How to Draw ...
- Bar Diagram Of Sales Comparison
- How to Draw a Pictorial Chart in ConceptDraw PRO | Sample ...
- House of Quality Matrix Software | ConceptDraw Solution Park ...
- Bar Diagrams for Problem Solving. Create business management ...
- Workflow Diagram Software | The Best Drawing Program for Mac ...
- Competitive feature comparison matrix chart - Digital scouting ...
- Flow chart Example. Warehouse Flowchart | Process Flowchart ...
- Flowchart Example: Flow Chart of Marketing Analysis | Scatter Chart ...
- Create Workflow Diagram | Business Processes | Cross-Functional ...
- Work Flow Process Chart | Workflow Diagram | Software Work Flow ...
- Process Flowchart | How to Draw a Pictorial Chart in ConceptDraw ...
- Business Processes Area | ConceptDraw Solution Park | Workflow ...
- SWOT analysis Software & Template for Macintosh and Windows
- Financial Comparison Chart | Bar Diagrams for Problem Solving ...
- Design elements - Picture graphs | ConceptDraw Solution Park ...
- Process Flowchart | Accounting Flowcharts | Audit Flowcharts ...
