This marketing diagram sample depicts service-goods continuum.
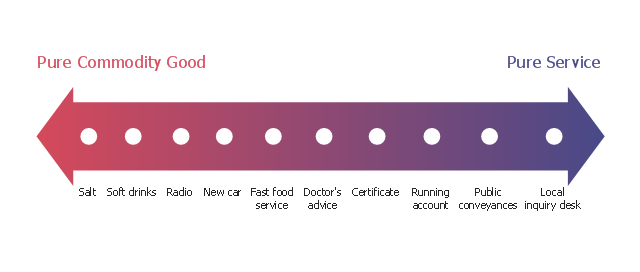
"The dichotomy between physical goods and intangible services is an oversimplification; these are not discrete categories. Most business theorists see a continuum with pure service at one endpoint and pure commodity goods at the other endpoint. Most products fall between these two extremes. Goods are normally structural and can be transferred in an instant while services are delivered over a period of time. Goods can be returned while a service once delivered cannot. Goods are not always tangible and may be virtual." [Goods and services. Wikipedia]
The marketing chart example "Service-goods continuum diagram" was created using the ConceptDraw PRO diagramming and vector drawing software extended with the Marketing Diagrams solution from the Marketing area of ConceptDraw Solution Park.
Marketing chart
This circle-spoke diagram sample shows the Porter five forces model. It was designed on the base of the Wikimedia Commons file: Modelo Porter.png. [commons.wikimedia.org/ wiki/ File:Modelo_ Porter.png]
"Porter's five forces analysis is a framework that attempts to analyze the level of competition within an industry and business strategy development. It draws upon industrial organization (IO) economics to derive five forces that determine the competitive intensity and therefore attractiveness of an Industry. Attractiveness in this context refers to the overall industry profitability. An "unattractive" industry is one in which the combination of these five forces acts to drive down overall profitability. A very unattractive industry would be one approaching "pure competition", in which available profits for all firms are driven to normal profit. This analysis is associated with its principal innovator Michael E. Porter of Harvard University. ...
Porter's five forces include – three forces from 'horizontal' competition: the threat of substitute products or services, the threat of established rivals, and the threat of new entrants; and two forces from 'vertical' competition: the bargaining power of suppliers and the bargaining power of customers." [Porter's five forces analysis. Wikipedia]
The hub-and-spoke diagram example "Porter five forces model" was created using the ConceptDraw PRO diagramming and vector drawing software extended with the Circle-Spoke Diagrams solution from the area "What is a Diagram" of ConceptDraw Solution Park.
Circle-spoke diagram

"Porter five forces analysis is a framework for industry analysis and business strategy development. It draws upon industrial organization (IO) economics to derive five forces that determine the competitive intensity and therefore attractiveness of a market. Attractiveness in this context refers to the overall industry profitability. An "unattractive" industry is one in which the combination of these five forces acts to drive down overall profitability. A very unattractive industry would be one approaching "pure competition", in which available profits for all firms are driven to normal profit.
Three of Porter's five forces refer to competition from external sources. The remainder are internal threats.
Porter referred to these forces as the micro environment, to contrast it with the more general term macro environment. They consist of those forces close to a company that affect its ability to serve its customers and make a profit. A change in any of the forces normally requires a business unit to re-assess the marketplace given the overall change in industry information. The overall industry attractiveness does not imply that every firm in the industry will return the same profitability. Firms are able to apply their core competencies, business model or network to achieve a profit above the industry average. A clear example of this is the airline industry. As an industry, profitability is low and yet individual companies, by applying unique business models, have been able to make a return in excess of the industry average.
Porter's five forces include - three forces from 'horizontal' competition: the threat of substitute products or services, the threat of established rivals, and the threat of new entrants; and two forces from 'vertical' competition: the bargaining power of suppliers and the bargaining power of customers.
This five forces analysis, is just one part of the complete Porter strategic models. The other elements are the value chain and the generic strategies." [Porter five forces analysis. Wikipedia]
The block diagram example "Porter's five forces model" was created using the ConceptDraw PRO diagramming and vector drawing software extended with the Block Diagrams solution from the area "What is a Diagram" of ConceptDraw Solution Park.
Block diagram

HelpDesk
How to Add a Block Diagram to a PowerPoint Presentation

How To Create Restaurant Floor Plan in Minutes


Design Element: Computer and Network for Network Diagrams
.png "Network Diagramming Tools, Design Elements - Computer and Network (Win Mac)")

Computer Network. Computer and Network Examples

- Service -goods continuum diagram | Process Flowchart | How To ...
- Diagram Of Pure Service And Pure Product
- Service -goods continuum diagram | Marketing Diagrams | Service ...
- Goods Service Continuum Diagram
- Copying Service Process Flowchart. Flowchart Examples | Block ...
- Service -goods continuum diagram | Marketing Diagrams | What Is ...
- Service -goods continuum diagram | Leadership and data - Circle ...
- Service -goods continuum diagram | Good Services Continuum
- Service -goods continuum diagram | Marketing Diagrams | Pyramid ...
- Service -goods continuum diagram | Copying Service Process ...
- Service -goods continuum diagram | Entity-Relationship Diagram ...
- Service -goods continuum diagram | Pyramid Chart Examples ...
- Block diagram - Gap model of service quality | Taxi Service Data ...
- Service -goods continuum diagram | Ecosystem goods and services ...
- Diagram of a Pyramid | Process Flowchart | Service -goods ...
- Pyramid Chart Examples | Service -goods continuum diagram ...
- Service -goods continuum diagram | Process Flowchart | Marketing ...
- Ecosystem goods and services - Segmented pyramid diagram ...
- Service -goods continuum diagram | Flow chart Example ...
- Best Diagramming | Social strategy - Pyramid diagram | Marketing ...