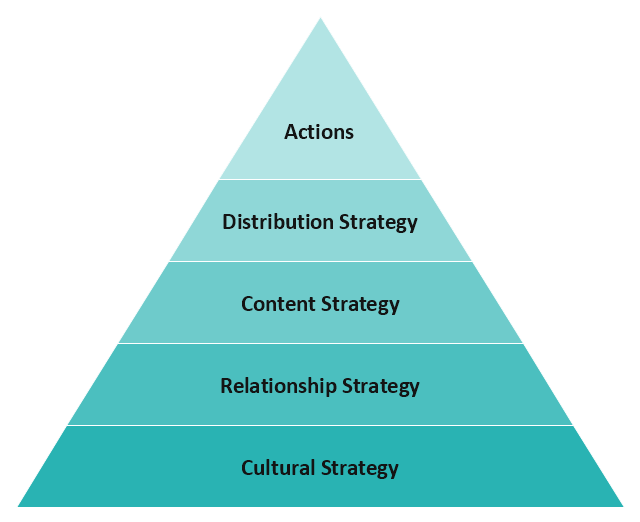
This social strategy pyramid diagram example has 5 levels: Actions, Distribution strategy, Content strategy, Relashionship strategy, Cultural strategy.
"Social marketing seeks to develop and integrate marketing concepts with other approaches to influence behaviors that benefit individuals and communities for the greater social good. It seeks to integrate research, best practice, theory, audience and partnership insight, to inform the delivery of competition sensitive and segmented social change programs that are effective, efficient, equitable and sustainable.
Although "social marketing" is sometimes seen only as using standard commercial marketing practices to achieve non-commercial goals, this is an oversimplification. The primary aim of social marketing is "social good", while in "commercial marketing" the aim is primarily "financial". This does not mean that commercial marketers can not contribute to achievement of social good.
Increasingly, social marketing is being described as having "two parents" - a "social parent", including social science and social policy approaches, and a "marketing parent", including commercial and public sector marketing approaches." [Social marketing. Wikipedia]
This triangular scheme sample "Social strategy" was created using the ConceptDraw PRO diagramming and vector drawing software extended with the Pyramid Diagrams solution from the Marketing area of ConceptDraw Solution Park.
Pyramid diagram
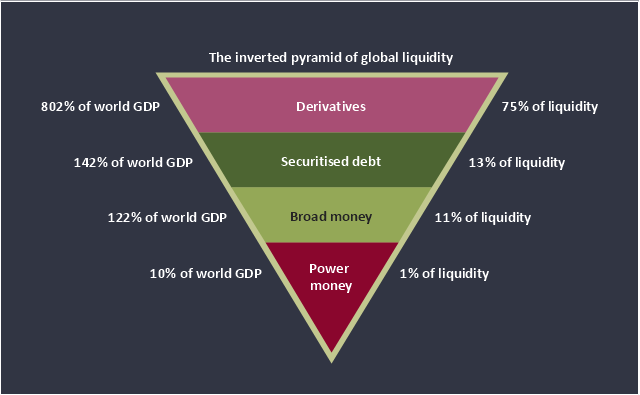
This inverted pyramid diagram of global liquidity shows world GDP and liquidity for 4 levels: derivatives, securitised debt, broad money, and power money.
"In business, economics or investment, market liquidity is a market's ability to facilitate an asset being sold quickly without having to reduce its price very much (or even at all). Equivalently, an asset's market liquidity (or simply "an asset's liquidity") is the asset's ability to sell quickly without having to reduce its price very much. Liquidity is about how big the trade-off is between the speed of the sale and the price it can be sold for. In a liquid market, the trade-off is mild: selling quickly will not reduce the price much. In a relatively illiquid market, selling it quickly will require cutting its price by some amount.
Money, or cash, is the most liquid asset, because it can be "sold" for goods and services instantly with no loss of value. There is no wait for a suitable buyer of the cash. There is no trade-off between speed and value. It can be used immediately to perform economic actions like buying, selling, or paying debt, meeting immediate wants and needs.
If an asset is moderately (or very) liquid, it has moderate (or high) liquidity. In an alternative definition, liquidity can mean the amount of highly liquid assets. If a business has moderate liquidity, it has a moderate amount of very liquid assets. If a business has sufficient liquidity, it has a sufficient amount of very liquid assets and the ability to meet its payment obligations." [Market liquidity. Wikipedia]
This inverted triangle diagram was redesigned using the ConceptDraw PRO diagramming and vector drawing software from Wikimedia Commons file The inverted pyramid of global liquidity.gif. [commons.wikimedia.org/ wiki/ File:The_ inverted_ pyramid_ of_ global_ liquidity.gif]
This triangular chart example is included in the Pyramid Diagrams solution from the Marketing area of ConceptDraw Solution Park.
Inverted pyramid diagram
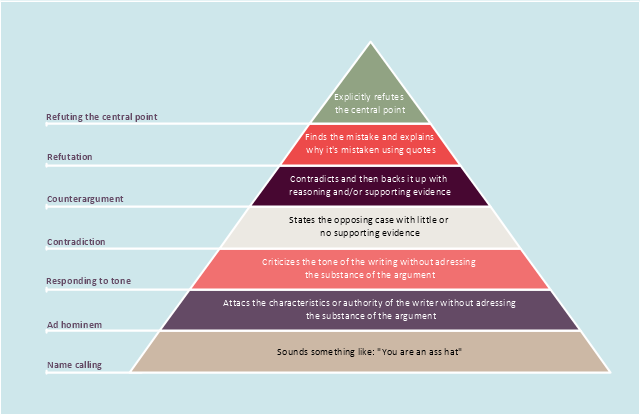
"Graham proposed a "disagreement hierarchy" in a 2008 essay "How to Disagree", putting types of argument into a seven-point hierarchy and observing that "If moving up the disagreement hierarchy makes people less mean, that will make most of them happier."
Although originally written as a simple list, Graham's hierarchy can be represented as a pyramid with the most convincing form of disagreement at the top, and the weakest at the bottom.
Graham notes that articulate forms of name-calling ("The author is a self-important dilettante.") are no different from crude insults, in this hierarchy." [Paul Graham (computer programmer). Wikipedia]
The pyramid diagram example "Graham's hierarchy of disagreement" was redesigned using the ConceptDraw PRO diagramming and vector drawing software from Wikimedia Commons file Graham's Hierarchy of Disagreement.svg. [commons.wikimedia.org/ wiki/ File:Graham's Hierarchy of Disagreement.svg]
The triangle chart example "Graham's hierarchy of disagreement" is included in the Pyramid Diagrams solution from the Marketing area of ConceptDraw Solution Park.
Pyramid diagram
Vertical Cross Functional Flowchart

 25 Typical Orgcharts
The 25 Typical Orgcharts solution contains powerful organizational structure and organizational management drawing tools, a variety of professionally designed organization chart and matrix organization structure samples, 25 templates based on various orga
 Business Process Mapping
The Business Process Mapping solution for ConceptDraw PRO is for users involved in process mapping and creating SIPOC diagrams.
 Circle-Spoke Diagrams
Examples of subject areas that are well suited to this approach are marketing, business, products promotion, process modeling, market, resource, time, and cost analysis. Circle-Spoke Diagrams are successfully used in presentations, conferences, management documents, magazines, reportages, reviews, reports, TV, and social media.
 Circular Arrows Diagrams
Circular Arrows Diagrams solution extends ConceptDraw PRO v10 with extensive drawing tools, predesigned samples, Circular flow diagram template for quick start, and a library of ready circular arrow vector stencils for drawing Circular Arrow Diagrams, Segmented Cycle Diagrams, and Circular Flow Diagrams. The elements in this solution help managers, analysts, business advisers, marketing experts, scientists, lecturers, and other knowledge workers in their daily work.
 Event-driven Process Chain Diagrams
Event-driven Process Chain (EPC) Diagram is a type of flowchart widely used for modeling in business engineering and reengineering, business process improvement, and analysis. EPC method was developed within the Architecture of Integrated Information Systems (ARIS) framework.
- 4 Level pyramid model diagram - Information systems types ...
- Pyramid Diagram | Process Flowchart | Pyramid Diagram | Chart Of ...
- Pyramid Diagram | Pyramid Diagram | Social strategy - Pyramid ...
- 4 Level pyramid model diagram - Information systems types
- Pyramid Diagram and Pyramid Chart | Pyramid Diagram ...
- How to Draw an Organization Chart | Examples of Flowcharts, Org ...
- Pyramid Diagram | Types of Flowcharts | Pyramid Diagram | Three ...
- Pyramid Diagram
- Social strategy - Pyramid diagram | Social Media Marketing ...
- Pyramid Diagram
- Diagram Of Social Pyramid
- Pyramid Diagram | Chart Examples | Pyramid Diagram | Inverted ...
- Service-goods continuum diagram | How To create Diagrams for ...
- Pyramid Diagram and Pyramid Chart
- Pyramid Diagram | Global liquidity inverted pyramid diagram ...
- Pyramid Diagram | Pyramid Chart Examples | Pyramid Diagram ...
- Competitor Analysis | Flowchart Example: Flow Chart of Marketing ...
- Time, quality, money triangle diagram | Pyramid Diagram | Pyramid ...
- Organizational culture - Triangle diagram | Pyramid Diagram ...
- Social strategy - Pyramid diagram | Ice Hockey Diagram – Defensive ...