"Crow's Foot notation is used in Barker's Notation, SSADM and Information Engineering. Crow's Foot diagrams represent entities as boxes, and relationships as lines between the boxes. Different shapes at the ends of these lines represent the cardinality of the relationship." [Entity–relationship model. Wikipedia]
The vector stencils library ERD, crow's foot notation contains 17 symbols for creating the ER-diagrams using the ConceptDraw PRO diagramming nd vector drawing software.
The example"Design elements - ERD solution (crow's foot notation)" is included in the Entity-Relationship Diagram (ERD) solution from the Software Development area of ConceptDraw Solution Park.
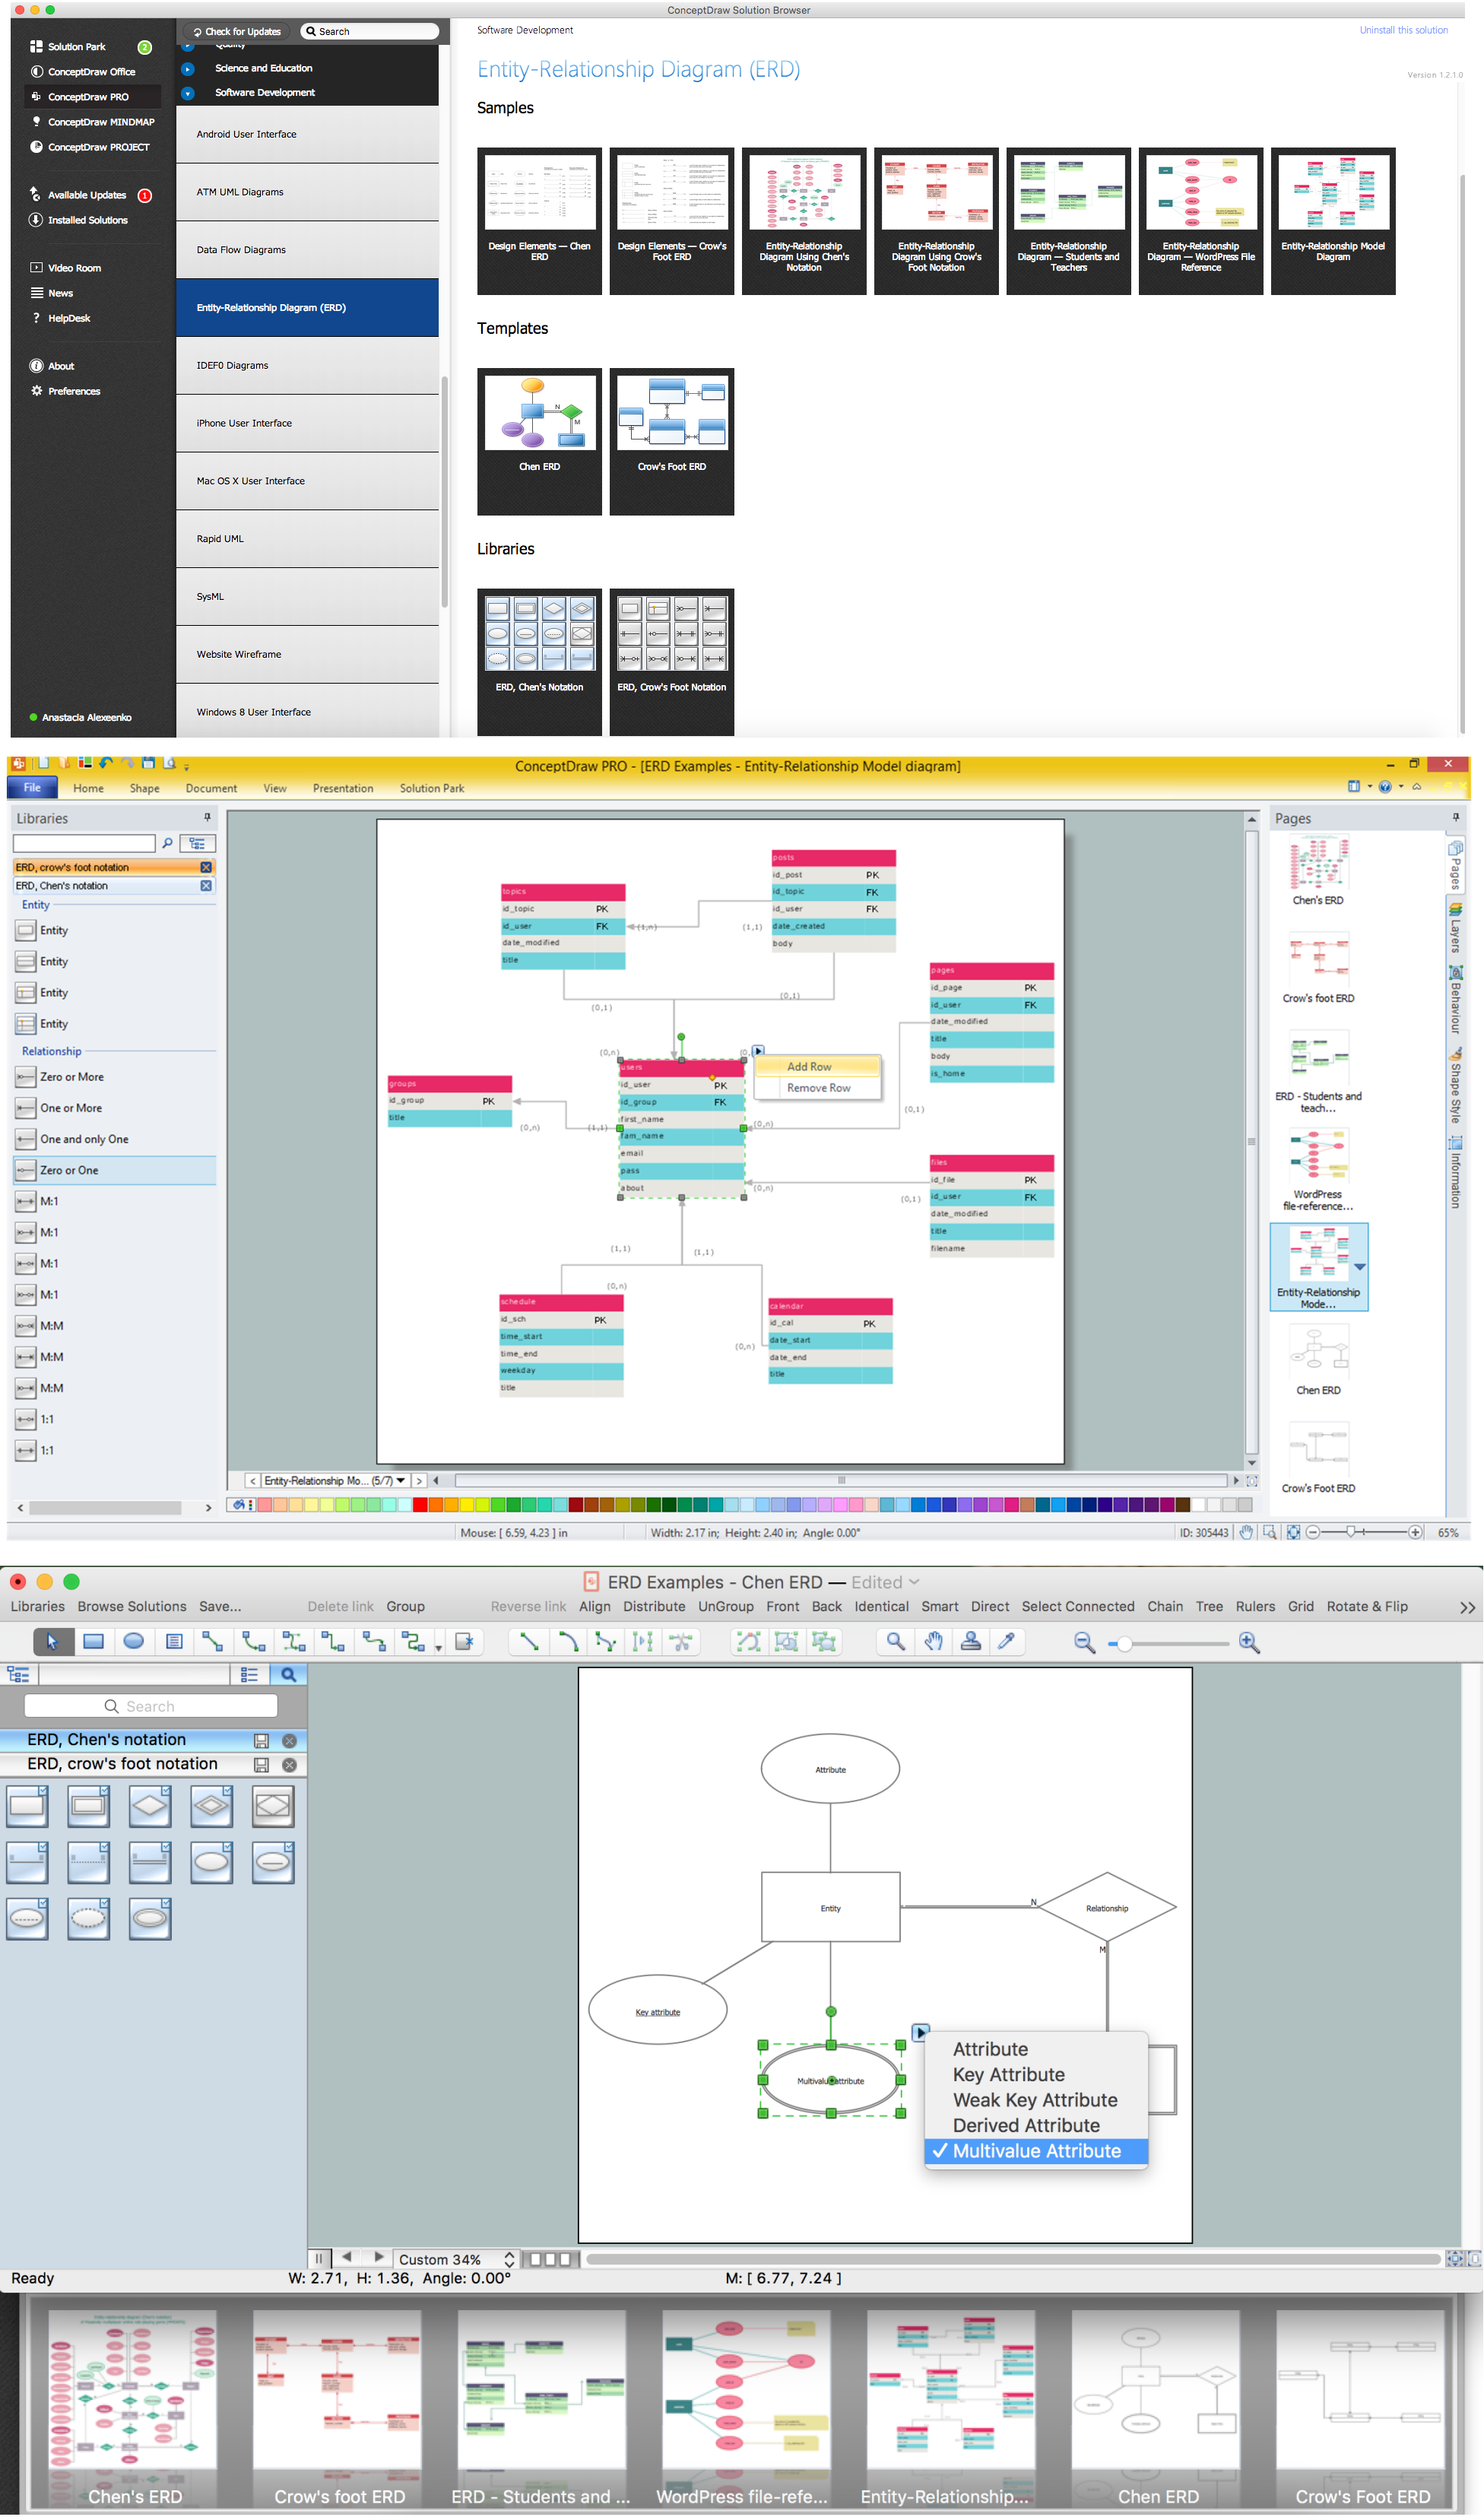
Entity Relationship Diagram Software
Entity Relationship Diagram (aka ERD, ER Diagram, E-R Diagram) is a well-tried software engineering tool for illustrating the logical structure of databases. Professional ERD drawing is an essential software engineering method for database modeling. Use powerful tools of ConceptDraw PRO Entity Relationship Diagram Software extended with Entity-Relationship Diagram (ERD) Solution.TQM Diagram Tool
The Total Quality Management Diagram solution helps you and your organization visualize business and industrial processes. Create Total Quality Management diagrams for business process with ConceptDraw software.Data structure diagram with ConceptDraw PRO
Data structure diagram (DSD) is intended for description of conceptual models of data (concepts and connections between them) in the graphic format for more obviousness. Data structure diagram includes entities description, connections between them and obligatory conditions and requirements which connect them. Create Data structure diagram with ConceptDraw PRO.Block Diagram
The vector stencils libraries: Block Diagrams, Blocks with Perspective, Callouts, Connectors, Raised Blocks from the solution Block Diagrams contain specific block diagram symbols such as arrows, input/output symbols, start/end symbols, processing symbols, conditional symbols, commenting symbols, callouts, connectors, etc. for ConceptDraw PRO diagramming and vector drawing software. The Block Diagrams solution is contained in a "What is a Diagram" area of ConceptDraw Solution Park.Use the libraries from the Block Diagrams solution to draw block diagrams for your business documents, presentations and websites in a few minutes.
How To Create a Bubble Chart
Bubble diagrams solution extends ConceptDraw PRO software with templates, Using ConceptDraw Connectors, you can create a bubble chart in moments.Using ConceptDraw you will be able to create a bubble chart from the ready ConceptDraw library objects or make your own objects. The created diagram can represent ideas organization, in brainstorming processes, by teachers for explaining difficult ideas or for presentations.
- ERD Symbols and Meanings | Entity Relationship Diagram Symbols ...
- Design elements - ERD (crow's foot notation) | Entity Relationship ...
- Entity-Relationship Diagram ( ERD ) with ConceptDraw PRO | Basic ...
- Design elements - ER diagram (Chen notation) | ERD , Chen's ...
- Best Way To Represent Data That Is Very Close
- ERD Symbols and Meanings | How to Draw a Floor Plan for Your ...
- Structured Systems Analysis and Design Method (SSADM) with ...
- Entity Relationship Diagram Software Engineering | ERD Symbols ...
- Best Way To Learn To Draw Crows Foot Erd
- Create Floor Plans Easily With ConceptDraw PRO | Seating Plans ...
- Entity-Relationship Diagram ( ERD ) | ATM Solutions | Entity ...
- ER Diagram for Cloud Computing | Sequence Diagram for Cloud ...
- Entity-Relationship Diagram ( ERD ) with ConceptDraw PRO | Entity ...
- ERD Symbols and Meanings | Entity Relationship Diagram Symbols ...
- Create Floor Plans Easily With ConceptDraw PRO | ERD Symbols ...
- Entity Relationship Diagram Software Engineering | Entity ...
- ER Diagram for Cloud Computing | Sequence Diagram for Cloud ...
- ERD Symbols and Meanings | Basic Flowchart Symbols and ...
- ERD Symbols and Meanings | Data Flow Diagram Symbols. DFD ...
- Basic Flowchart Symbols and Meaning | Flowchart Definition | ERD ...
.png--diagram-flowchart-example.png)


