This pie chart sample shows the atmosphere air composition. It was designed on the base of the Wikimedia Commons file: Air composition pie chart.JPG.
[commons.wikimedia.org/ wiki/ File:Air_ composition_ pie_ chart.JPG]
This file is licensed under the Creative Commons Attribution-Share Alike 3.0 Unported license. [creativecommons.org/ licenses/ by-sa/ 3.0/ deed.en]
"The atmosphere of Earth is a layer of gases surrounding the planet Earth that is retained by Earth's gravity. The atmosphere protects life on Earth by absorbing ultraviolet solar radiation, warming the surface through heat retention (greenhouse effect), and reducing temperature extremes between day and night (the diurnal temperature variation).
The common name given to the atmospheric gases used in breathing and photosynthesis is air. By volume, dry air contains 78.09% nitrogen, 20.95% oxygen, 0.93% argon, 0.039% carbon dioxide, and small amounts of other gases. Air also contains a variable amount of water vapor, on average around 1%. Although air content and atmospheric pressure vary at different layers, air suitable for the survival of terrestrial plants and terrestrial animals currently is only known to be found in Earth's troposphere and artificial atmospheres." [Atmosphere of Earth. Wikipedia]
The pie chart example "Atmosphere air composition" was created using the ConceptDraw PRO diagramming and vector drawing software extended with the Pie Charts solution of the Graphs and Charts area in ConceptDraw Solution Park.
Pie chart

Bar Diagrams for Problem Solving. Create space science bar charts with Bar Graphs Solution

 Nature
This solution extends ConceptDraw PRO software with samples, templates and libraries of vector clipart for drawing the Nature illustrations. Use it to make professional-looking documents, presentations and websites illustrated with color scalable vector c
Aerospace - Design Elements

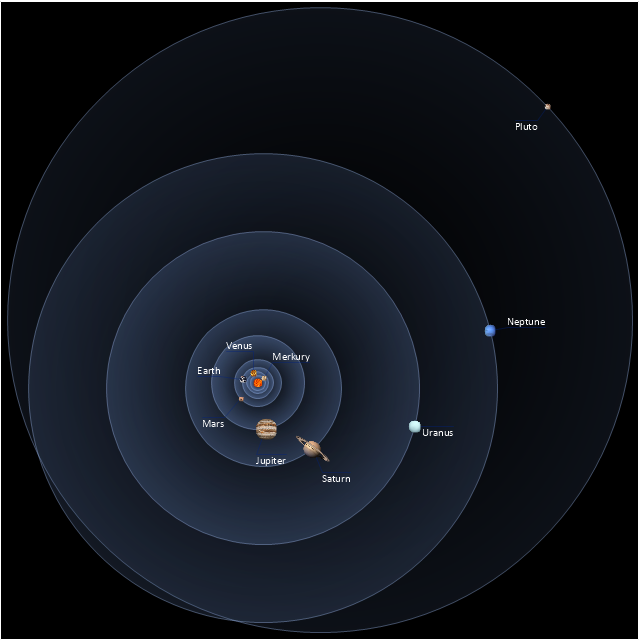
This vector stencils library contains 30 clipart images and astronomical symbols of sun and stars, solar system planets and moon.
Use these shapes for drawing your astronomical diagrams and illustrations.
Use these shapes for drawing your astronomical diagrams and illustrations.
Solar system
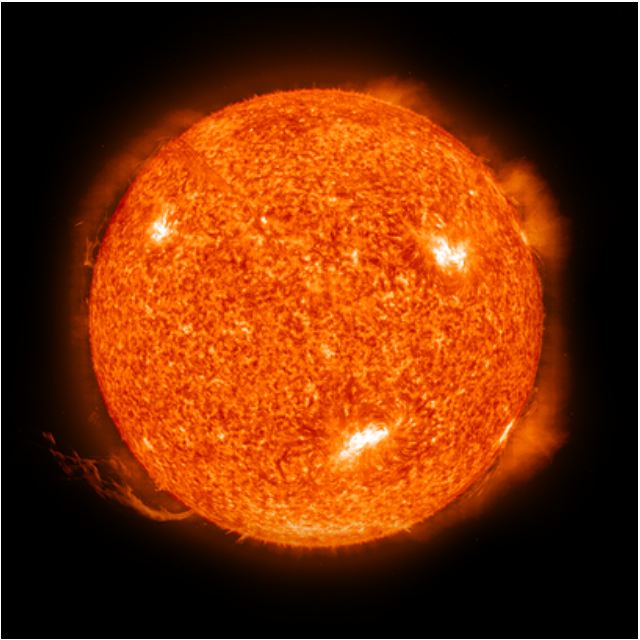
Sun
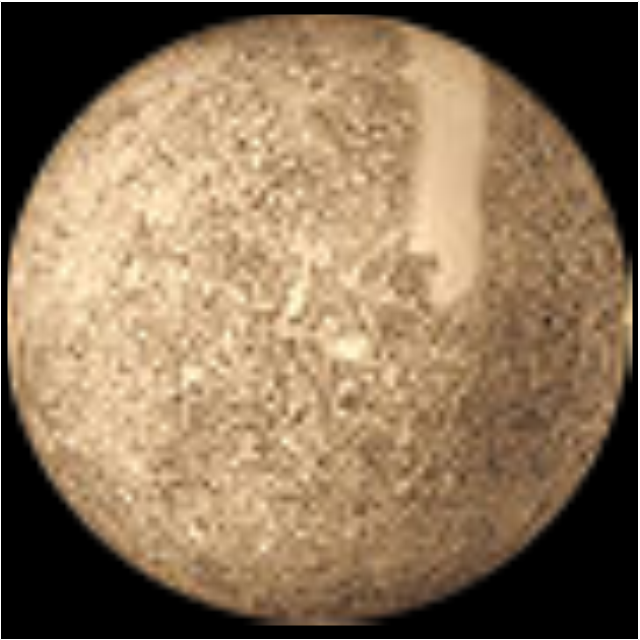
Mercury
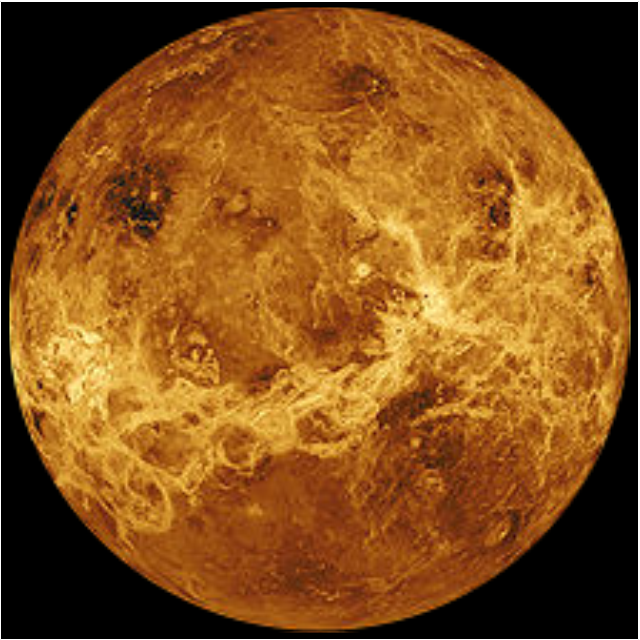
Venus
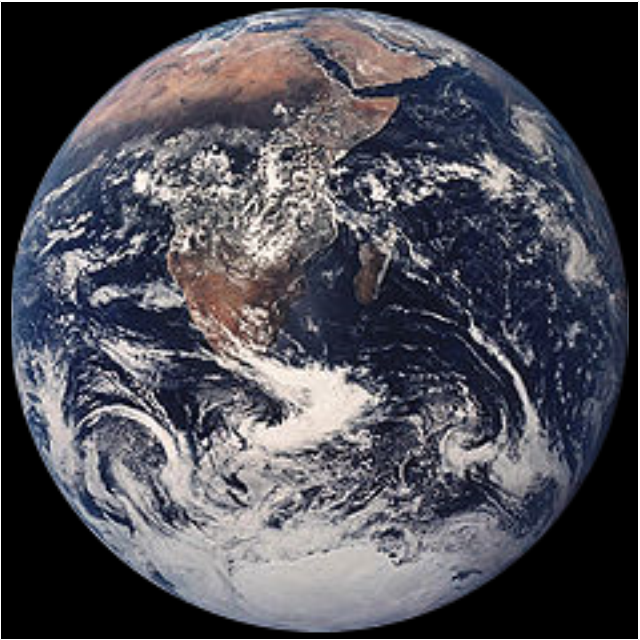
Earth
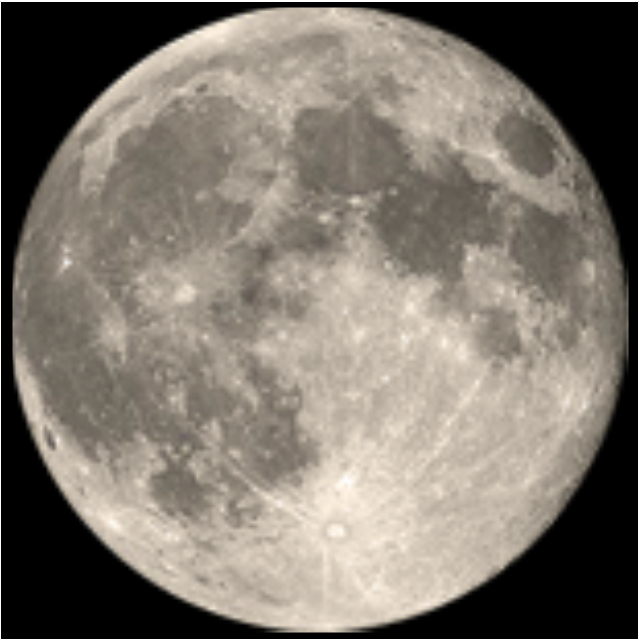
Moon
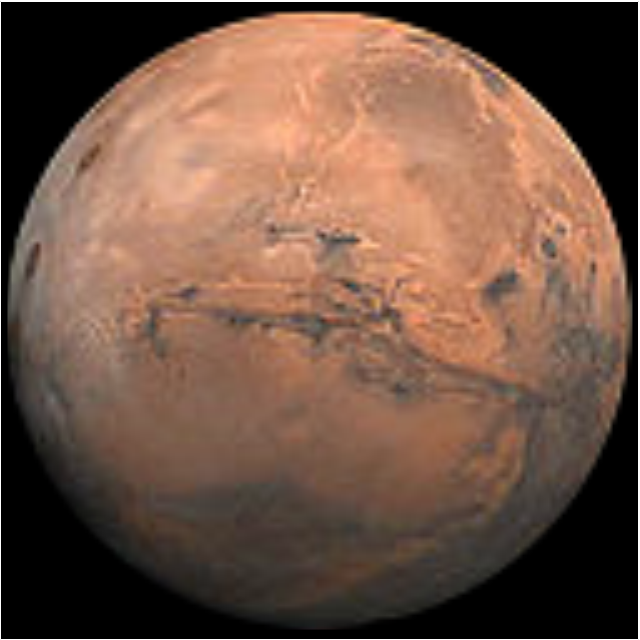
Mars
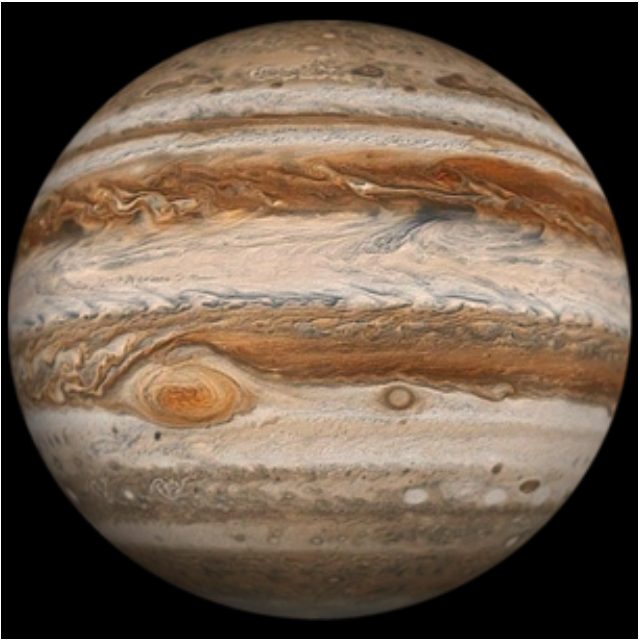
Jupiter
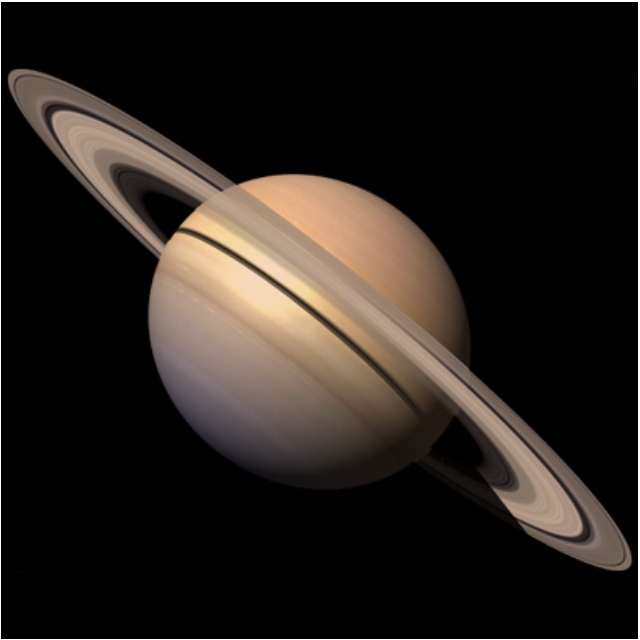
Saturn
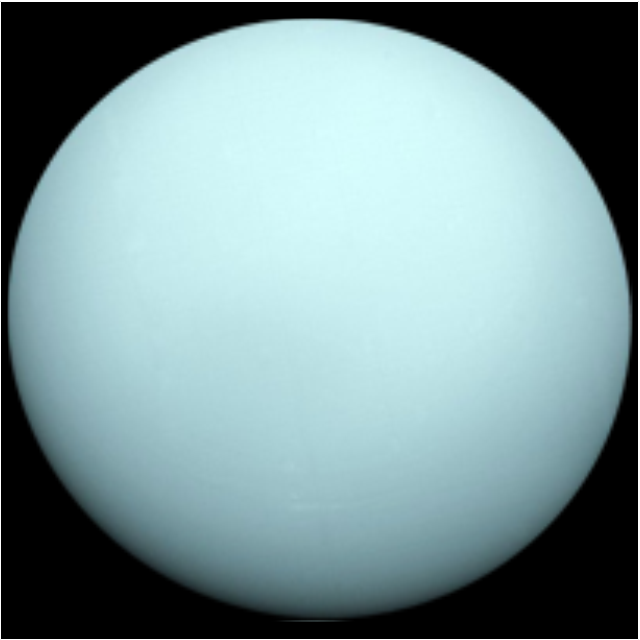
Uranus
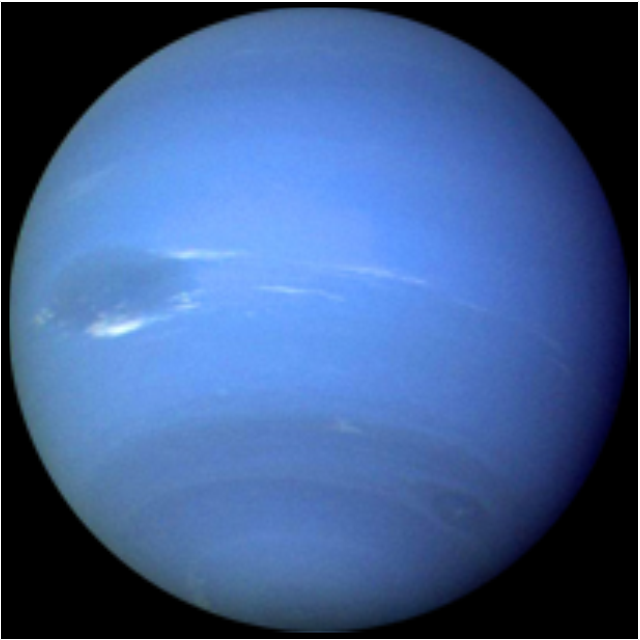
Neptune
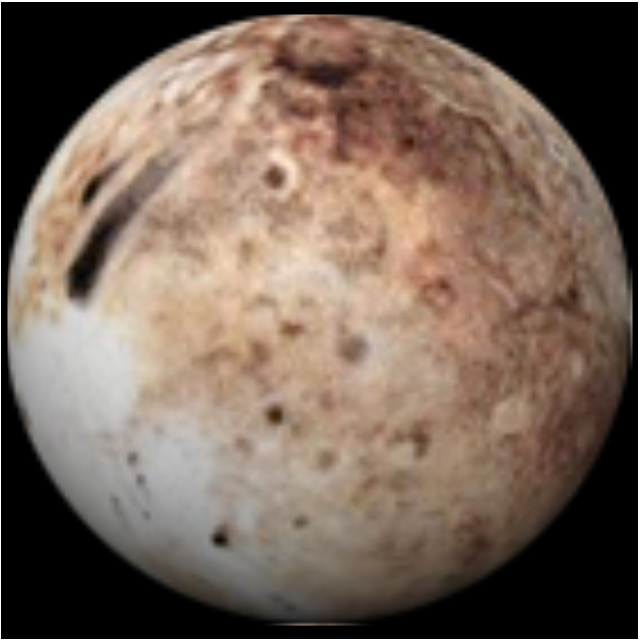
Pluto
Red giant
Yellow giant
Blue giant

Red dwarf
White dwarf

Black hole
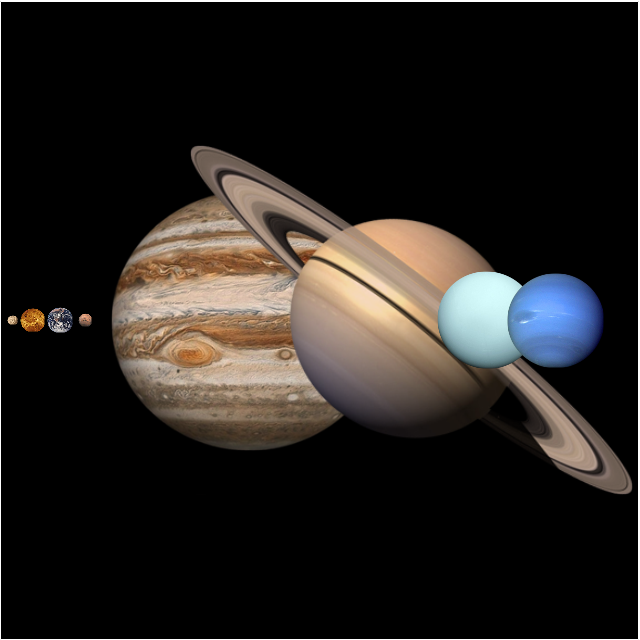
Planets to scale
Sun symbol
Mercury symbol
Venus symbol
Earth symbol
Moon symbol

Mars symbol
Jupiter symbol

Saturn symbol

Neptune symbol
Uranus symbol
Pluto symbol

- Percentage Of Water On Earth Pie Chart
- Percentage Pie Chart . Pie Chart Examples | Atmosphere air ...
- Water cycle diagram | Swim Lane Diagrams | Pie Chart Examples ...
- How Pie Chart On Water Of Earth
- Pie Diagram On Percentage Of Water Available On Earth
- Atmosphere air composition | Water cycle diagram | Percentage Pie ...
- Pie Chart And Components Of Water
- Pie Chart Showing The Composition Of Water
- Composition Of Water Sample Pie Graph
- Pie Chart Component Of Water
- Water Pie Chart
- Atmosphere air composition | Percentage Pie Chart . Pie Chart ...
- Atmosphere air composition | CERES data flow diagram ...
- Show The Availability Of Water With Help Of Pie Diagram
- Water cycle diagram | EU greenhouse gas emissions - Management ...
- Components Of Water Pie Chart
- Gas Components Of Earth Pie Chart
- Atmosphere air composition | Pie Chart For Air Gas
- Approximate composition of the air - Pie chart | Pie Chart On The ...
- Weather - Vector stencils library | Water cycle diagram | Approximate ...