HelpDesk
How to Create a Venn Diagram

Cylinder Venn Diagram

 Basic Venn Diagrams
This solution extends ConceptDraw DIAGRAM (or later) with samples, templates, and libraries of vector stencils for drawing Venn Diagrams.
Venn Diagram Examples for Problem Solving. Venn Diagram as a Truth Table

3 Circle Venn Diagram. Venn Diagram Example

Venn Diagram Template
Basic Circles Venn Diagram. Venn Diagram Example

Venn Diagram Examples for Problem Solving. Computer Science. Chomsky Hierarchy

Multi Layer Venn Diagram. Venn Diagram Example

Venn Diagram

- Hexagon Logo
- Venn Diagram Illustrator
- Project Management Venn Diagram
- Venn Diagrams | Community elements overlapping | Path to ...
- Venn diagram - Relationship marketing | Cause and Effect Fishbone ...
- How to Create a Venn Diagram | Venn Diagrams | Multi Layer Venn ...
- 4-Set Venn diagram - Template | Venn diagrams - Vector stencils ...
- Systems engineering improvement | Venn Diagrams | Chemical and ...
- 3 Set Venn Diagram
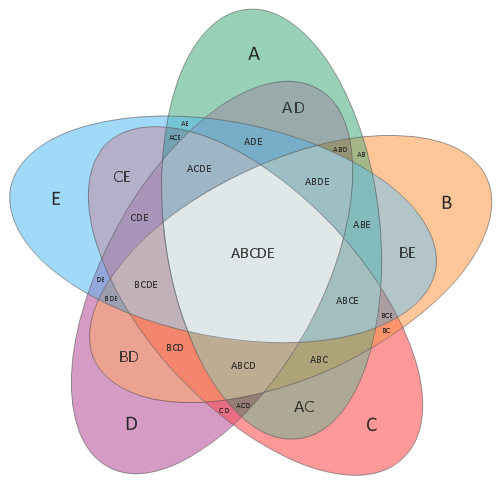
- 5-Set Venn diagram - Template | Venn diagrams - Vector stencils ...