 Venn Diagrams
Venn Diagrams are actively used to illustrate simple set relationships in set theory and probability theory, logic and statistics, mathematics and computer science, linguistics, sociology, and marketing. Venn Diagrams are also often used to visually summarize the status and future viability of a project.
Use this template to design your five set Venn diagrams.
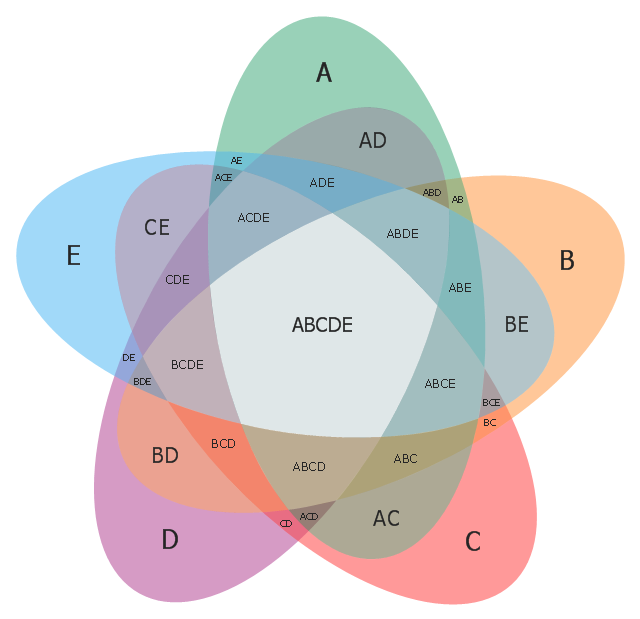
"Five-set Venn diagram using congruent ellipses in a radially symmetrical arrangement devised by Branko Grünbaum. Labels have been simplified for greater readability." [Venn diagram. Wikipedia]
The template "5-set Venn diagram" for the ConceptDraw PRO diagramming and vector drawing software is included in the Venn Diagrams solution from the area "What is a Diagram" of ConceptDraw Solution Park.
Template
HelpDesk
How to Draw a Circular Arrows Diagram Using ConceptDraw PRO

Cross Functional Flowchart for Business Process Mapping

ConceptDraw Arrows10 Technology

- Venn Diagrams | Venn Diagram Examples for Problem Solving ...
- 5-Set Venn diagram - Template | Venn Diagram Template for Word ...
- Venn Diagram Examples for Problem Solving. Venn Diagram as a ...
- 5-Set Venn diagram - Template
- Venn Diagram Template | 3 Circle Venn Diagram . Venn Diagram ...
- 5-Set Venn diagram - Template | Venn diagrams - Vector stencils ...
- Venn Diagram Examples for Problem Solving. Computer Science ...
- 4 -Set Venn diagram - Template | Venn Diagram Examples for ...
- Venn Diagram Examples for Problem Solving. Environmental Social ...
- Venn Diagram Template for Word | Venn Diagrams | How to Create ...
- 5-Set Venn diagram - Template | Venn Diagrams | Venn Diagram ...
- 5-Set Venn diagram - Template | Venn Diagrams | Venn diagrams ...
- 5-Set Venn diagram - Template | 4 -Set Venn diagram - Template ...
- Basic Flowchart Symbols and Meaning | Venn Diagram Examples ...
- Five Way Venn Diagram
- Design elements - UML use case diagrams | UML Sequence ...
- Using Fishbone Diagrams for Problem Solving | Venn Diagram ...
- Pyramid Diagram | Venn Diagram Examples for Problem Solving ...
- Venn Diagrams | Venn Diagram Maker | Venn Diagram Examples ...
- Venn Diagrams | How to Create a Venn Diagram in ConceptDraw ...