HelpDesk
How to Create Flowchart Using Standard Flowchart Symbols
Flowcharts are used to display an algorithm for consistent execution of certain steps. Flowchart is probably the easiest way to make a graphical representation of any process. Flowcharts use the set of standard geometric symbols and arrows to define relationships. ConceptDraw PRO allows you to create professional flowchart quickly and easily. The ability to create flowcharts is contained in the Flowcharts solution. The solution provides a set of special tools for creating flowcharts.HelpDesk
How to Create a Timeline Diagram in ConceptDraw PRO
A Timeline is a chart which displays a project plan schedule in chronological order. A Timeline is used in project management to depict project milestones and visualize project phases, and show project progress. The graphic form of a timeline makes it easy to understand critical project milestones, such as the progress of a project schedule. Timelines are particularly useful for project scheduling or project management when accompanied with a Gantt chart. It captures the main of what the project will accomplish and how it will be done. making a project timeline is one of the most important skills a project manager needs have. Making comprehensive, accurate timelines allows you getting every project off in the best way. ConceptDraw PRO allows you to draw a timeline charts using special library.How To Create Restaurant Floor Plan in Minutes
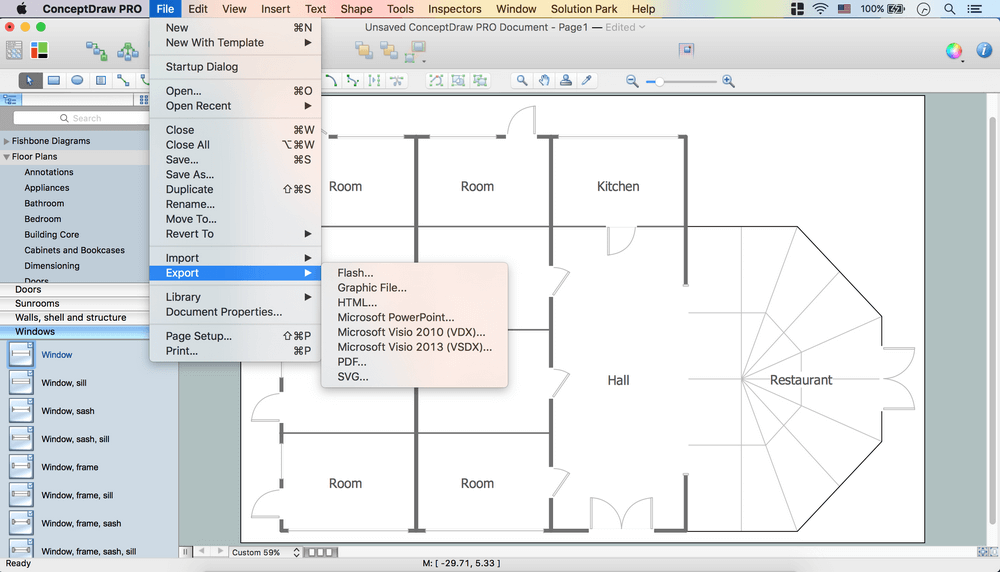
Developing Floor Plans, Design Drawings, Plans of Furniture Placement for restaurants and cafes is one of the most responsible and important steps at their construction and designing. Selection of favorable design, the right style of furniture and decors largely determine the success and atmosphere of the institution. The restaurant floor planner ConceptDraw PRO is a perfect choice for architects and designers. Enhanced with Cafe and Restaurant Floor Plans solution it offers a lot of extensive vector symbol libraries and building plan elements for drawing Restaurant floor plans, Restaurant layouts, Restaurant furniture layouts, Cafe floor plans, Bar area floor plan, Fast food restaurant plan, etc. With ConceptDraw PRO you don't need to be an artist to create great-looking restaurant floor plan drawings in minutes, all needed drawing tools are delivered by Building Plans area solutions. Construct your own general plan of restaurant's premises, choose the furniture for your taste from the Cafe and Restaurant Floor Plans solution libraries and arrange it on the plan as you desire fast and easy. ConceptDraw PRO has many of the features found in Visio for Mac such as Drawing, Connection, Shape and Editing Tools.
HelpDesk
How to Draw a Gantt Chart Using ConceptDraw PRO
A Gantt chart is intended to provide a visualization of a project schedule. It is developed to help planning, coordinating, and tracking on project tasks implementation. One of the most critical resources for a project implementation is a time resources. Gantt chart - is one of the most convenient and popular way of graphical representation of a project tasks progress in conjunction with the corresponding time consumption. Gantt chart's function is to show project tasks completion in a progress, and to make a project manager sure that project tasks were completed on time. ConceptDraw Office is a clear and easy-to-use tool for project management. It is a very handy visual tool that helps make a project processing clear.HelpDesk
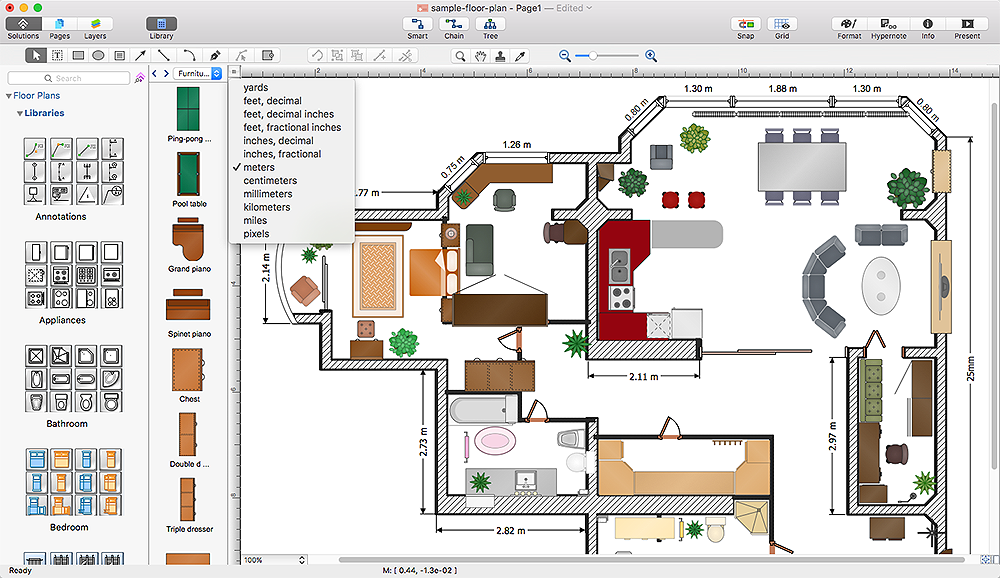
How to Change the Measurement Units and Drawing Scale
ConceptDraw PRO allows you to work with drawings with many different measurement units.HelpDesk
How to Draw a Pictorial Chart in ConceptDraw PRO
Pictorial Infographics is used to visually present data comparison. Pictorial charts use relative sizes or repetitions of the same icon, picture, or symbol to show data relation. Using a Pictorial chart to show business data patterns and trends will add much more efficiency to your business communications. Finding the right tool for the job can sometimes be tricky. Developing sophisticated and effective infographics can require toolsthat may span many different products. Fortunately, ConceptDraw PRO has everything you need to create polished Pictorial Infographics that beautifully and accurately represent your story, no matter how complex it may be.HelpDesk
How to Draw a Pie Chart Using ConceptDraw PRO
A pie chart represents data, in a clear and easy to read round (pie) form. A circular pie chart is divided into sections (slice). Each "slice" depicts the It reflects the proportion of each component in the whole "pie". This type of chart is most often used for the visualization of statistical data. That is why pie charts are widely used in marketing. As pie charts show proportional proportional parts of a whole, they are good for various visual comparisons. For example, it is difficult to imagine a more intuitive way to show segmentation and market share. ConceptDraw PRO allows you to draw a simple and clear Pie Chart using the Pie Charts solution.Create Floor Plans Easily with ConceptDraw PRO
How to create Floor Plan Design easy and effectively? You can invite an interior designer and trust this work to him, which is usually expensive and result may not always meet your expectations. Another way is to design it yourself, but at this case you need to have special skills, knowledges and abilities, among them basic knowledge of the composition rules, color theory, materials science and software for interior design development. The ability to use specialized software for drawing is especially valuable, useful and saves your time. ConceptDraw PRO is one of the best among similar software, it offers extensive functionality, powerful tools, a lot of features, and is simple for using, so can be applied by everyone without efforts. Enhanced with Floor Plans and other solutions from the Building Plans area, the ConceptDraw PRO software helps easily create unique and harmonious interior designs, and draw in desired scale professional-looking Floor Plans and Layouts for homes, apartments, hotels, offices, and other buildings. ConceptDraw PRO is a full Visio compatibility and better alternative for students, teachers and business professionals to reliably create kinds of flowcharts, organizational charts, network diagrams, floor plans, electrical diagrams, software design diagrams, maps and more.
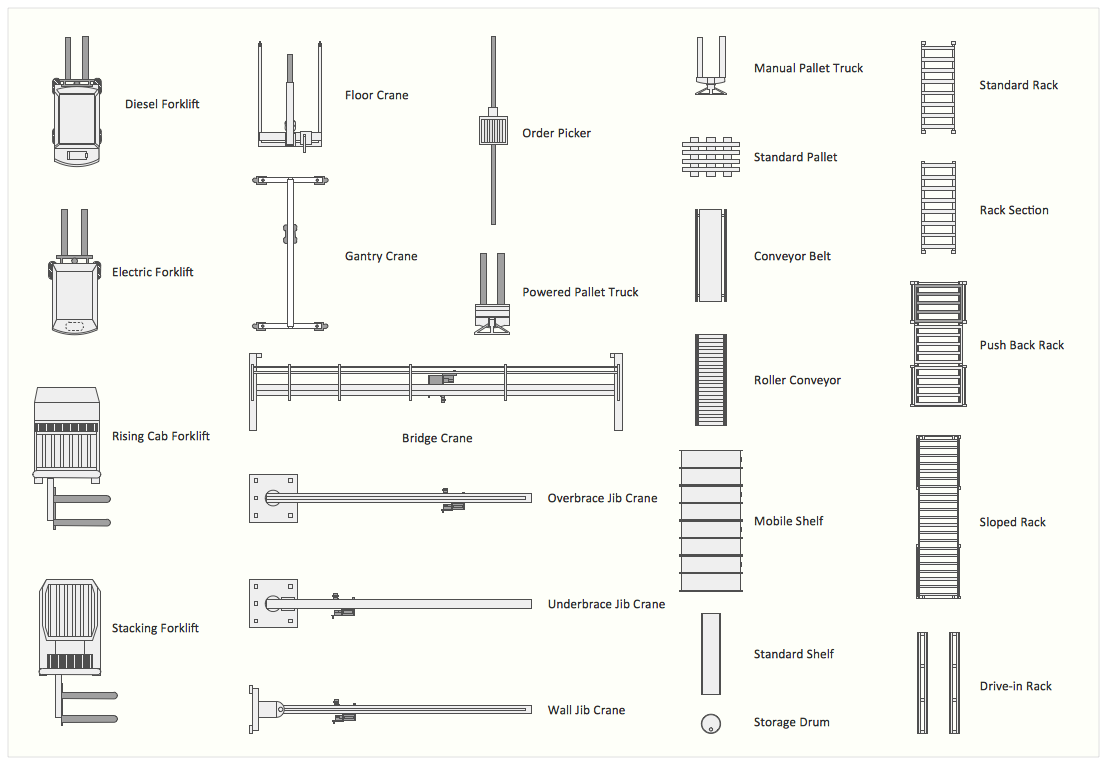
Interior Design Storage and Distribution - Design Elements
Successful and comfy interior design has a great value for the premises of any kinds, for home, flats, offices, stores, and even for warehouses, industrial spaces, factories and plants. Development and professional representing of interior design projects is an interesting and exciting process, but quite difficult at the same time. Interior designer must clearly respect and take into account all wishes and requirements of the customer. But the use of special design software can greatly help in interior design. ConceptDraw PRO diagramming and vector drawing software extended with Plant Layout Plans solution includes the Storage and Distribution library with large quantity of vector design symbols and elements of storage and distribution industrial equipment, of forklifts, cranes, pallets, shelves, and racks of any kinds. They provide effective assistance in design various types of plant interior designs, plant interior design floor plans, industrial warehouse plans, storage and distribution industrial equipment layouts for the premises of any magnitude and destiny.HelpDesk
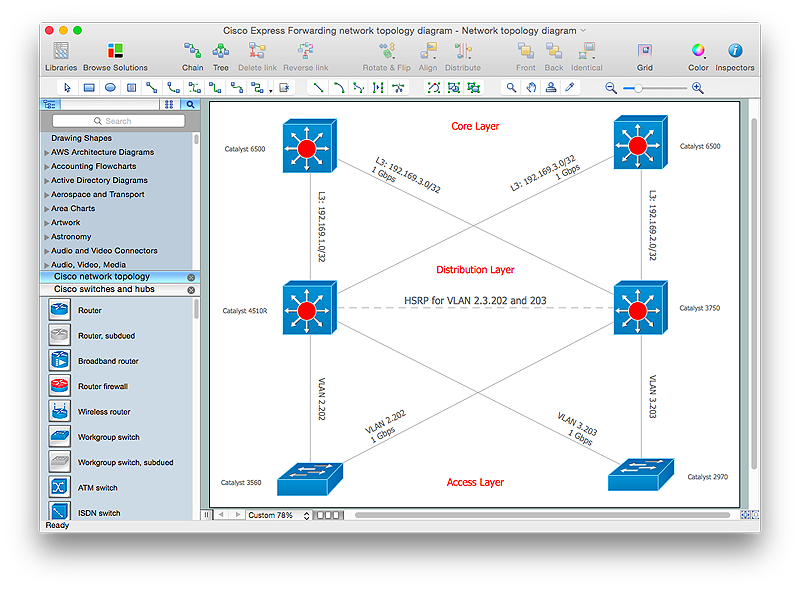
How to Create Cisco Network Diagrams
The easiest way to design Cisco Network diagram using standard Cisco product symbols is using ConceptDraw PRO powered by Cisco Network Diagrams solution. The Cisco Network Diagrams solution uses Cisco network symbols to to visually document the topology and design of Cisco networks.HelpDesk
How to Draw an Area Chart in ConceptDraw PRO
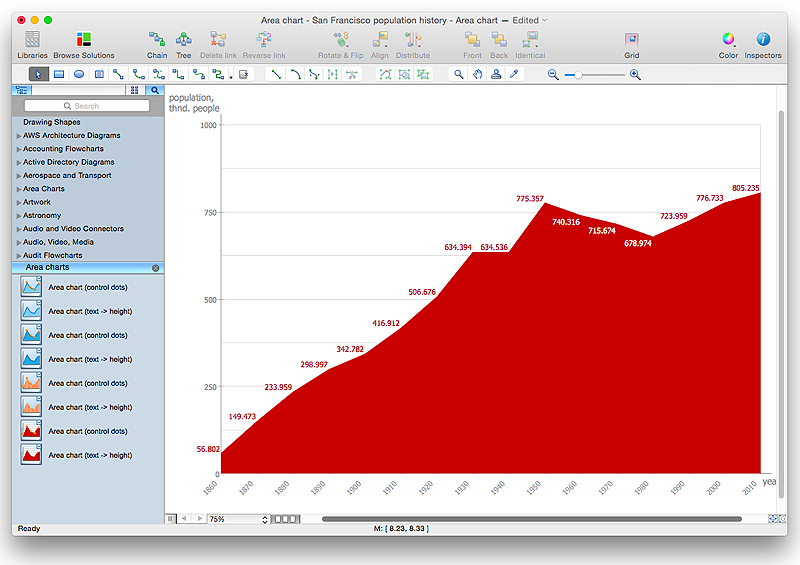
Area chart is similar to a line chart, but an area chart has an area, commonly filled with color below the line. The applying of Line charts and area charts are also very similar. They both show continuity across a data set. They are both can be used for displaying time series data and for depicting tendencies better than separate values, but they have some different characteristics. Using the proper one is good chance to show once again a professionalism of your graphic documents. An area chart depicts a colored area below the line. The sum on the vertical axis of an area chart represents the entire value, while the height of each separate piece shows its parts. Area charts are used to display multiple data series with proportion to a whole value , or for separate data series showing a set of countable values, or cumulative data.HelpDesk
How to Draw Chemistry Structures
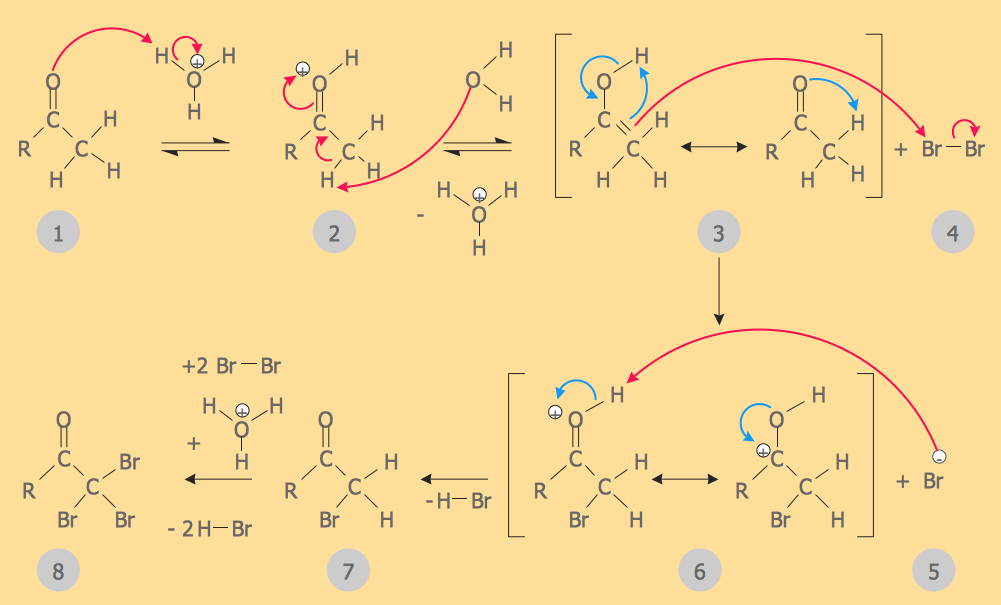
Making chemistry drawings for science and education purposes involves many different elements that can be managed using ConceptDraw PRO. ConceptDraw Chemistry solution can be used as a tool for creating chemical schemes and diagrams of chemical lab set-ups and labware, formulas, reaction schemes, and molecular structures. With ConceptDraw PRO you can easily create and communicate chemistry drawings of any complexity.HelpDesk
How to Create a Computer Network Diagram in ConceptDraw PRO
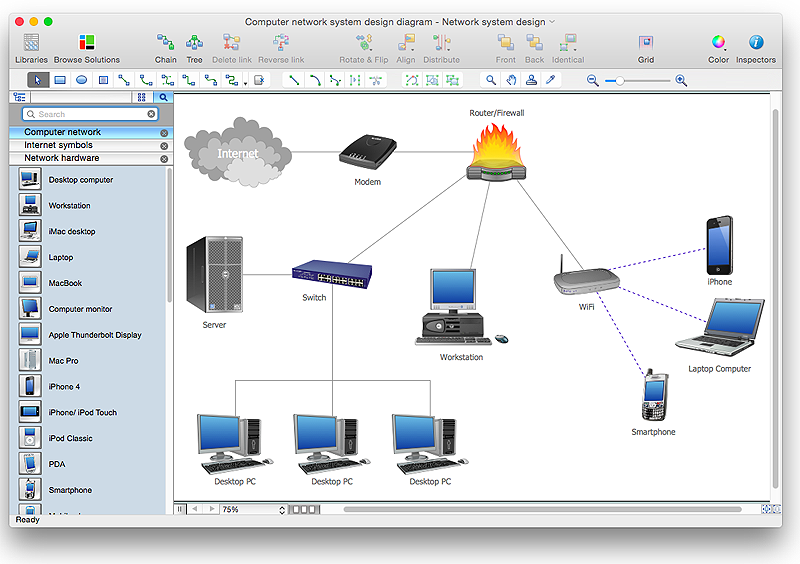
Computer Network diagram is intended to depict how a computer network is built and connected. It shows how data transfers between connections, and presents an overview of hardware and devices used. With the Conceptdraw solution for Computer Network Diagrams, system administrators, network architects and other related IT specialists have a perfect drawing tool that supplies adjective vector stencils representing hardware, telecom devices, and logical symbols that enhance possibilities in network diagramming, however complex the real network may be.HelpDesk
How to Draw an Organizational Chart Using ConceptDraw PRO
The organizational chart software is a valuable tool for modern business. It is important for any business to build a clear organizational structure that determines the responsibilities and relationships between different positions in the organization. The clear structured organization - means the clear structured business workflow, which is the core of success in the business. ConceptDraw PRO is an org chart software that allows you to draw an organizational structure of your company quickly and easily.HelpDesk
How to Draw a Pareto Chart
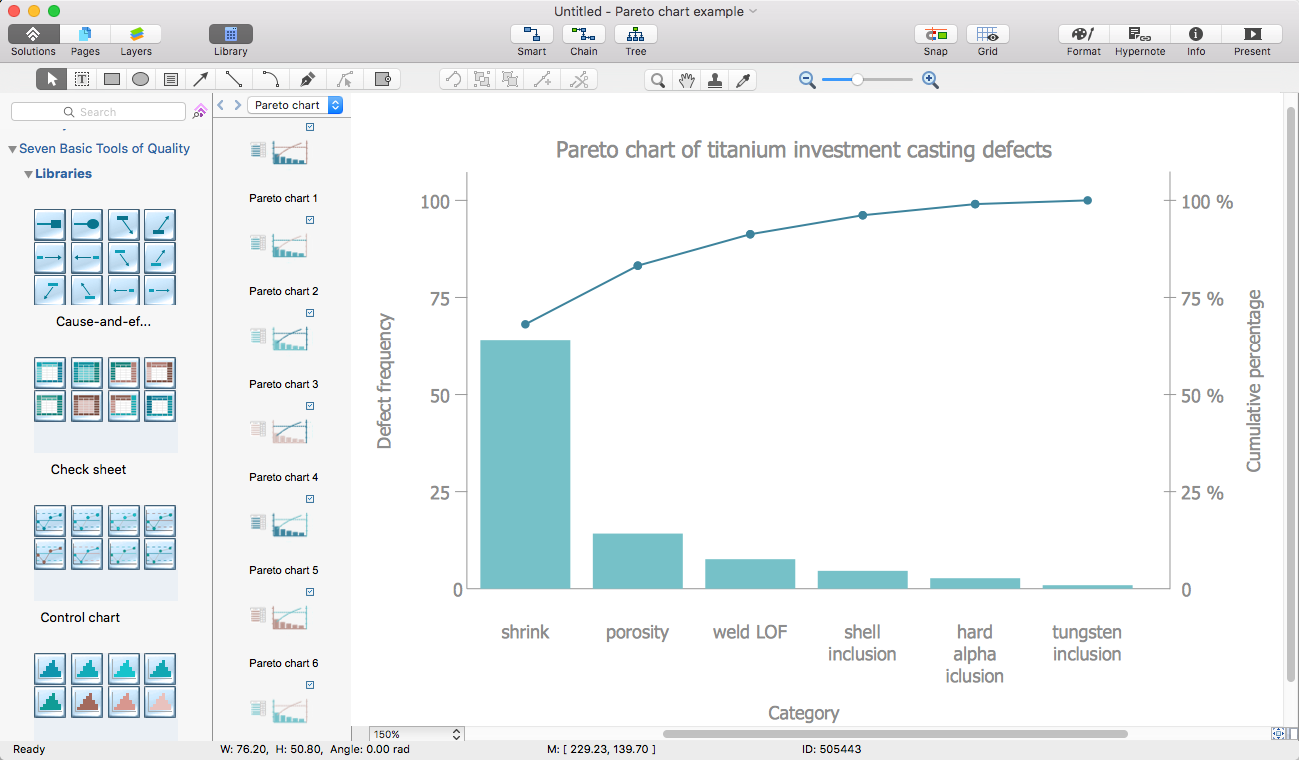
The Seven Basic Tools of Quality were picked as effective visual tool-set for identifying the root cause of quality-related problems within the workplace. Seven Basic Tools of Quality comprise of seven diagram that are diverse enough to be used to any business troubleshooting scenario, but simple enough that employees of all types can understand and apply them. One of these tools is a Pareto chart. It combines both a line graph and a bar chart, where the bar chart displays data values, and a line represents a total value. Pareto chart is used for quality control to identify the source of the quality problem. ConceptDraw Seven Basic Tools of Quality solution delivers a big set of vector stencil libraries and samples for each quality control diagram, including a Pareto chart.- Basic Flowchart Symbols and Meaning | How to Draw a Flowchart ...
- Entity Relationship Diagram Symbols | Basic Flowchart Symbols and ...
- Sample Process Flow Using Display Symbols
- Basic Flowchart Symbols and Meaning | Flowchart design ...
- Electrical Drawing Software | How To use House Electrical Plan ...
- Process Flowchart | Basic Flowchart Symbols and Meaning | Flow ...
- Basic Flowchart Symbols and Meaning | Flowchart design ...
- Basic Flowchart Symbols and Meaning | Cross-Functional Flowchart ...
- How To Draw Building Plans | How To use House Electrical Plan ...
- How To use Furniture Symbols for Drawing Building Plan | Cisco ...
- Process Flowchart | Basic Flowchart Symbols and Meaning | Data ...
- Draw Sketch Of Computer File Structure
- How To Draw Data Flow Diagram
- Computer Manufacturing Process Flow Chart
- Telecommunication Network Diagrams | How To Create a MS Visio ...
- Basic Flowchart Symbols and Meaning | Simple Flow Chart ...
- Computer Network Plan
- How To Create Restaurant Floor Plan in Minutes | Restaurant ...
- How to Draw Chemistry Structures | Process Flowchart | Basic ...
- Process Flowchart | Basic Flowchart Symbols and Meaning ...


