 Logistic Dashboard
The powerful tools of Logistic Dashboard solution and specially developed live graphic objects of logistic icons, logistic navigation elements, logistic indicators, logistic charts and logistic maps effectively assist in designing Logistic dashboards, Logistic maps, Logistic charts, diagrams and infographics. The included set of prebuilt samples and quick-start templates, demonstrates the power of ConceptDraw DIAGRAM software in logistics management, its assisting abilities in development, realization and analyzing the logistic processes, as well as in perfection the methods of logistics management.
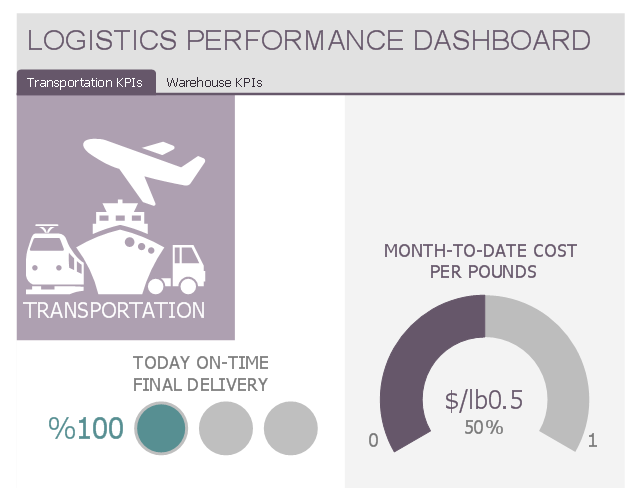
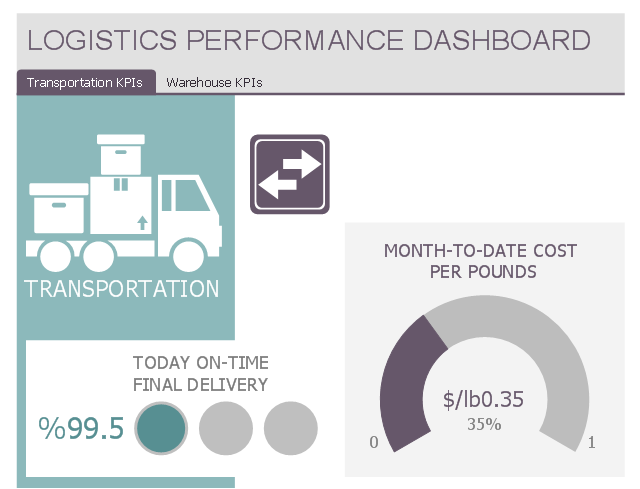
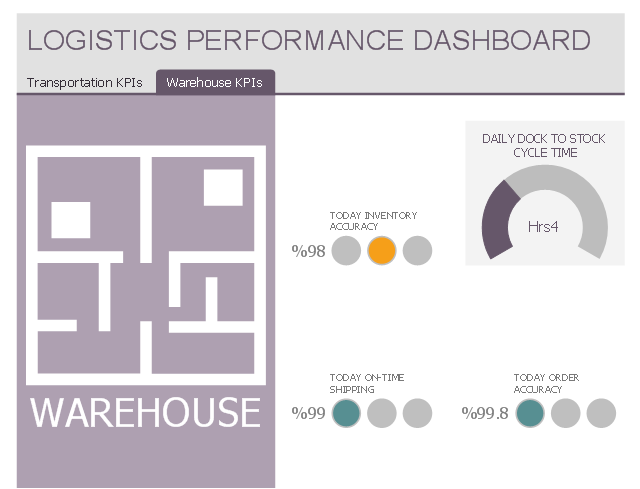
This multipage performance dashboard template contains navigation tab set and graphic indicators of logistic key performance indicators (KPIs) and business metrics.
Use it to create your logistic performance dashboard with ConceptDraw PRO software.
The business dashboard template "Logistics Performance Dashboard" is included in Logistic Dashboard solution from Business Processes area of ConceptDraw Solution Park.
Use it to create your logistic performance dashboard with ConceptDraw PRO software.
The business dashboard template "Logistics Performance Dashboard" is included in Logistic Dashboard solution from Business Processes area of ConceptDraw Solution Park.
Transportation KPIs
Warehouse KPIs

This multipage performance dashboard example shows navigation tab set and graphic indicators of logistic key performance indicators (KPIs) and business metrics.
"Dashboards often provide at-a-glance views of KPIs (key performance indicators) relevant to a particular objective or business process (e.g. sales, marketing, human resources, or production)." [Dashboard (business). Wikipedia]
The business dashboard example "Logistics Performance Dashboard" was designed using ConceptDraw PRO software extended with Logistic Dashboard solution from Business Processes area of ConceptDraw Solution Park.
Transportation KPIs
Warehouse KPIs
 Sales Dashboard
Sales Dashboard solution extends ConceptDraw DIAGRAM software with templates, samples and library of vector stencils for drawing the visual dashboards of sale metrics and key performance indicators (KPI).
 CRM Center Dashboard
The CRM Center Dashboard solution extends ConceptDraw DIAGRAM functionality with CRM software tools, large collection of CRM Charts live objects, CRM icons, CRM indicators, CRM maps and navigation elements, the set of professionally designed CRM samples and templates to help you construct your own CRM Dashboards and CRM Center Dashboards in a few minutes, to depict the current and actual data by connecting or refreshing the data source file. The customer management software ConceptDraw DIAGRAM makes you free to choose the style for your dashboard and to regulate the quantity of clipart on the diagram according to your taste.
 Meter Dashboard
Meter dashboard solution extends ConceptDraw DIAGRAM software with templates, samples and vector stencils library with meter indicators for drawing visual dashboards showing quantitative data.
 HR Dashboard
The HR Dashboard solution extends ConceptDraw DIAGRAM functionality with powerful drawing tools and great collection of comprehensive vector design elements, icons, pictograms and objects, navigation elements, live objects of HR charts, HR indicators, and thematic maps. The range of HR Dashboards applications is extensive, among them the human resource management, recruitment, hiring process, human resource development. ConceptDraw DIAGRAM software is perfect for creation HR Dashboard with any goal you need. It gives you all opportunities for designing not only informative, but also professional looking and attractive HR Dashboards of any style and degree of detalization, that are perfect for using in presentations, reports and other thematic documents.
 Status Dashboard
Status dashboard solution extends ConceptDraw DIAGRAM software with templates, samples and vector stencils libraries with graphic indicators for drawing the visual dashboards showing status data.
Data Visualization Solutions

Performance Indicators

- Download Kpi Transportation Logistics Dashboard Xls
- Logistics Performance Dashboard - Template | Sales KPIs ...
- Logistic Dashboard | How to Make a Logistic Dashboard | Logistics ...
- Performance Indicators | KPI Dashboard | Constant improvement of ...
- Health And Safety Kpi Dashboard
- Aerospace and Transport | PM Dashboards | Sales Dashboard ...
- Status Dashboard | Business Intelligence Dashboard | Meter ...
- KPI Dashboard | Business Graphics Software | Logistics ...
- Sales Dashboard Template | Logistic Dashboard | Logistics and ...
- KPI Dashboard | Sales Dashboard Template | Sales KPI ...