Entity-Relationship Diagram

Design Element: Crows Foot for Entity Relationship Diagram - ERD

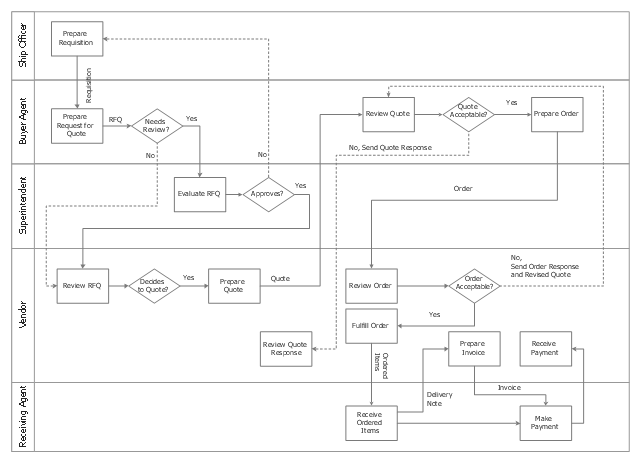
This swim lane diagram sample shows the trading process flow.
"Trade, also called goods exchange economy, is to transfer the ownership of goods from one person or entity to another by getting something in exchange from the buyer. Trade is sometimes loosely called commerce or financial transaction or barter. A network that allows trade is called a market. ...
Modern traders ... generally negotiate through a medium of exchange, such as money. As a result, buying can be separated from selling, or earning. ...
Retail trade consists of the sale of goods or merchandise from a very fixed location, such as a department store, boutique or kiosk, or by mail, in small or individual lots for direct consumption by the purchaser. Wholesale trade is defined as the sale of goods that are sold merchandise to retailers, to industrial, commercial, institutional, or other professional business users, or to other wholesalers and related subordinated services." [Trade. Wikipedia]
The swimlane diagram example "Process flowchart - Trading process" was created using the ConceptDraw PRO diagramming and vector drawing software extended with the Process Flowcharts solution from the Business Processes area of ConceptDraw Solution Park.
Swim lane diagram
Notation & Symbols for ERD

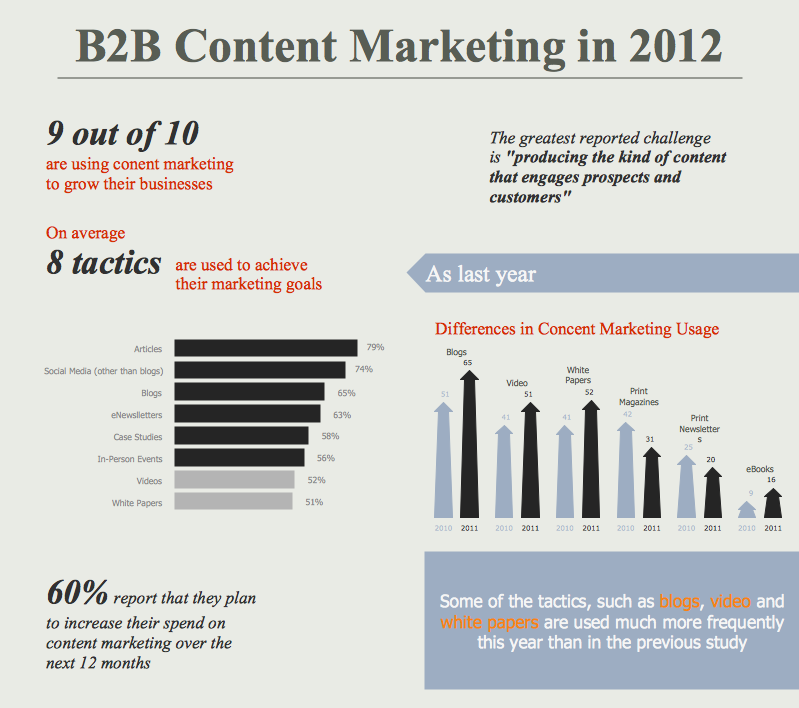
Content Marketing Infographics
ConceptDraw DIAGRAM ER Diagram Tool

Powerful Drawing Feature for Creating Professional Diagrams

Structured Systems Analysis and Design Method. SSADM with ConceptDraw DIAGRAM

UML Class Diagram Tutorial

Data Flow Diagram (DFD)

- Entity Relationship Diagram - ERD - Software for Design Crows Foot ...
- Departmental Store Deployment Diagram
- Entity -Relationship Diagram (ERD) | Er Diagram Of Departmental ...
- ERD Symbols and Meanings | Entity Relationship Diagram ...
- Entity -Relationship Diagram (ERD) | Er Diagram For Store
- Process flowchart - Trading process | Retail Store Shopping Process ...
- Example of DFD for Online Store (Data Flow Diagram) | Financial ...
- Process flowchart - Trading process | Flowcharts | Retail Store ...
- UML Use Case Diagram Example - Estate Agency | Financial Trade ...
- Process flowchart - Trading process | Groups in a supply chain cut ...