 Line Graphs
How to draw a Line Graph with ease? The Line Graphs solution extends the capabilities of ConceptDraw PRO v10 with professionally designed templates, samples, and a library of vector stencils for drawing perfect Line Graphs.
 Basic Line Graphs
This solution extends the capabilities of ConceptDraw PRO v10.3.0 (or later) with templates, samples and a library of vector stencils for drawing Line Graphs.
How to Make a Timeline

Project Timeline

This area chart sample shows the US federal prisoner population changes from 1914 to 2010.
"The Federal Bureau of Prisons (BOP) is a United States federal law enforcement agency. A subdivision of the U.S. Department of Justice, the Bureau is responsible for the administration of the federal prison system. The system also handles prisoners who committed acts considered felonies under the District of Columbia's law. The Bureau was established in 1930 to provide more progressive and humane care for federal inmates, to professionalize the prison service, and to ensure consistent and centralized administration of the 11 federal prisons in operation at the time.
According to its official web site, the Bureau consists of more than 116 institutions, six regional offices, its headquarters office in Washington, D.C., two staff training centers, and 22 community corrections offices, and is responsible for the custody and care of approximately 210,000 federal offenders. Approximately 82 percent of these inmates are confined in Bureau-operated correctional facilities or detention centers. The remainder are confined through agreements with state and local governments or through contracts with privately operated community corrections centers, detention centers, prisons, and juvenile facilities." [Federal Bureau of Prisons. Wikipedia]
This area graph sample was redesigned from the Wikimedia Commons file: Federal timeline US prisoners.gif. [commons.wikimedia.org/ wiki/ File:Federal_ timeline_ US_ prisoners.gif]
The area chart example "Federal timeline US prisoners" was created using the ConceptDraw PRO diagramming and vector drawing software extended with the Area Charts solution from the Graphs and Charts area of ConceptDraw Solution Park.
Area graph

 Timeline Diagrams
Timeline Diagrams solution extends ConceptDraw PRO diagramming software with samples, templates and libraries of specially developed smart vector design elements of timeline bars, time intervals, milestones, events, today marker, legend, and many other elements with custom properties, helpful for professional drawing clear and intuitive Timeline Diagrams. Use it to design simple Timeline Diagrams and designate only the main project stages, or highly detailed Timeline Diagrams depicting all project tasks, subtasks, milestones, deadlines, responsible persons and other description information, ideal for applying in presentations, reports, education materials, and other documentation.
Line Chart Examples

Line Graph

Line Graph Charting Software

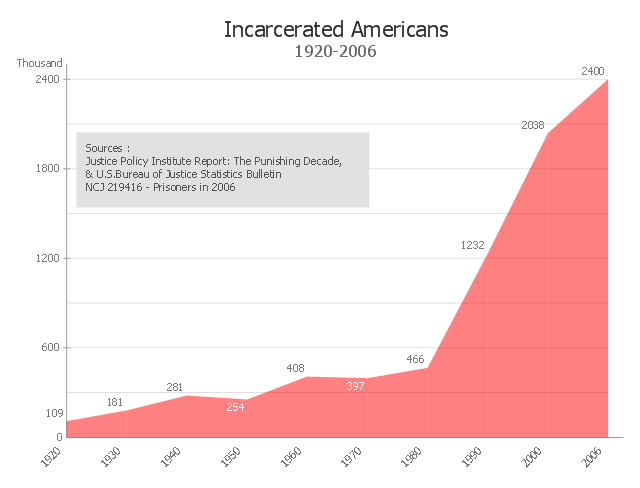
This area chart sample shows the timeline of total number of inmates in U.S. prisons, jails, and juvenile facilities from 1920 to 2006. It was redesigned from the Wikimedia Commons file: US incarceration timeline-clean.gif. [commons.wikimedia.org/ wiki/ File:US_ incarceration_ timeline-clean.gif]
"Incarceration in the United States of America is one of the main forms of punishment, rehabilitation, or both for the commission of felony and other offenses. The United States has the highest documented incarceration rate in the world. At year-end 2009, it was 743 adults incarcerated per 100,000 population.
According to the U.S. Bureau of Justice Statistics (BJS), 2,266,800 adults were incarcerated in U.S. federal and state prisons, and county jails at year-end 2011 – about 0.94% of adults in the U.S. resident population. Additionally, 4,814,200 adults at year-end 2011 were on probation or on parole. In total, 6,977,700 adults were under correctional supervision (probation, parole, jail, or prison) in 2011 – about 2.9% of adults in the U.S. resident population.
In addition, there were 70,792 juveniles in juvenile detention in 2010.
Although debtor's prisons no longer exist in the United States, residents of some U.S. states can still be incarcerated for debt as of 2014." [Incarceration in the United States. Wikipedia]
The area graph example "US incarceration timeline-clean" was created using the ConceptDraw PRO diagramming and vector drawing software extended with the Area Charts solution from the Graphs and Charts area of ConceptDraw Solution Park.
Area graph
- How to Create a Timeline Diagram in ConceptDraw PRO | Project ...
- Fishbone Diagrams | How Is A Timeline Graph Applied To Problem ...
- Timeline Diagrams | Line Graphs | Basic Line Graphs | Time Line ...
- Project Timeline | Timeline Examples | How to Make a Timeline ...
- Time Line Chart For Atm
- Timeline Diagrams | Competitor Analysis | Line Graph | Bar Diagram ...
- Timeline Graph Mac
- Timeline Diagrams | Line Graphs | Area Charts | Time Line Chart For ...
- Fishbone Diagram | Timeline Diagrams | Basic Line Graphs | Time ...
- Bar chart - Template | Timeline Diagrams | Management Area ...