Electrical Symbols — Thermo

Electrical Symbols, Electrical Diagram Symbols

Process Flow Chart

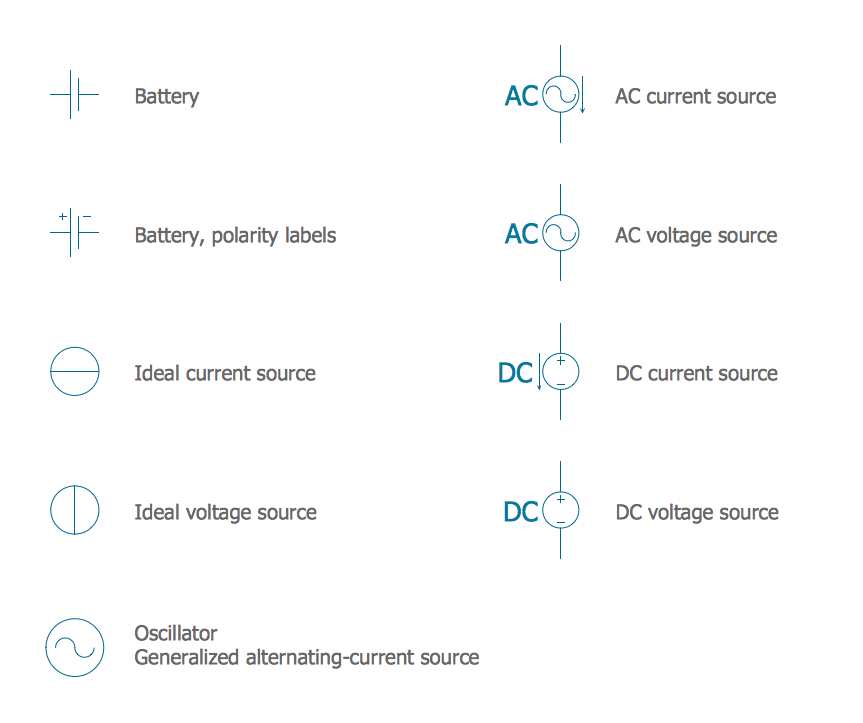
Electrical Symbols — Power Sources
Process Flow Diagram Symbols

This ecology infographic example was created on the base of the infographics "Greenhouse gas emissions in the EU" from the Debating Europe website. [debatingeurope.eu/ wp-content/ uploads/ 2013/ 06/ TH_ 2_ social.png]
"A greenhouse gas (sometimes abbreviated GHG) is a gas in an atmosphere that absorbs and emits radiation within the thermal infrared range. This process is the fundamental cause of the greenhouse effect. The primary greenhouse gases in the Earth's atmosphere are water vapor, carbon dioxide, methane, nitrous oxide, and ozone. Greenhouse gases greatly affect the temperature of the Earth; without them, Earth's surface would average about 33 °C colder, which is about 59 °F below the present average of 14 °C (57 °F)." [Greenhouse gas. Wikipedia]
The ecology infographic example "EU greenhouse gas emissions" was created using the ConceptDraw PRO diagramming and vector drawing software extended with the Management Infographics solition from the area "Business Infographics" in ConceptDraw Solution Park.
Ecology infographics example

Used Solutions
- Plant Layout Plans | Design elements - Stations | Electrical Symbols ...
- Factory Drawing Plan Thermal Power Plant
- Clipart Power Station
- Plant Layout Plans | Factory layout floor plan | How to Create a Plant ...
- Gas Powerplant Logo
- Ecology pictograms - Vector stencils library | Ecology pictograms ...
- Ecology pictograms - Vector stencils library | Design elements ...
- Space Station Vector Art
- Fire safety equipment - Vector stencils library | Design elements ...
- Energy Pyramid Diagram | Resources and energy - Vector stencils ...
- Ecology pictograms - Vector stencils library | Interior Design Piping ...
- Chemical and Process Engineering | Chemical engineering - Vector ...
- Electrical Engineering Man Vector
- Satellites | Organizational Charts with ConceptDraw PRO | Forces ...
- Weather - Vector stencils library | Aerospace - Vector stencils library ...
- Design elements - Ecology pictograms
- Site Plans | Site plan | Ecology pictograms - Vector stencils library ...
- Resources and energy - Vector stencils library | Electrical Drawing ...
- Ecology pictograms - Vector stencils library | Design Pictorial ...
- Industrial equipment - Vector stencils library | Industrial transport ...