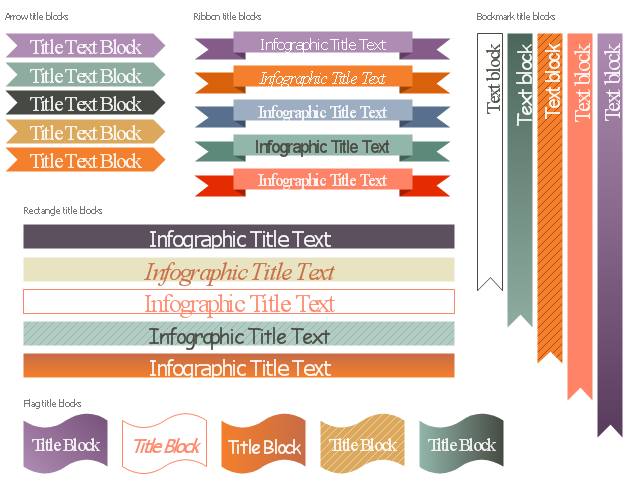
The vector stencils library "Title blocks" contains title and bookmark text blocks for creating marketing infograms.
"The title of a book, or any other published text or work of art, is a name for the work which is usually chosen by the author. A title can be used to identify the work, to place it in context, to convey a minimal summary of its contents, and to pique the reader's curiosity.
Some works supplement the title with a subtitle. Texts without separate titles may be referred to by their incipit, especially those produced before the practice of titling became popular. During development, a work may be referred to by a temporary working title. A piece of legislation may have both a short title and a long title. In library cataloging, a uniform title is assigned to a work whose title is ambiguous.In book design, the title is typically shown on the spine, the front cover, and the title page." [Title (publishing). Wikipedia]
The shapes example "Design elements - Title blocks" was created using the ConceptDraw PRO diagramming and vector drawing software extended with the Marketing Infographics solition from the area "Business Infographics" in ConceptDraw Solution Park.
Titles and bookmarks
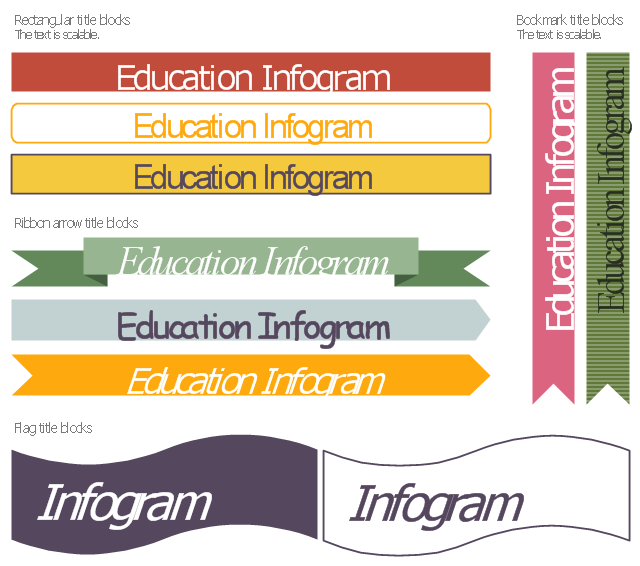
The vector stencils library "Education title blocks" contains 10 title block shapes: rectangular, arrow, ribbon, bookmark, flag.
Use these elements to design your educational infograms.
"The title of a book, or any other published text or work of art, is a name for the work which is usually chosen by the author. A title can be used to identify the work, to place it in context, to convey a minimal summary of its contents, and to pique the reader's curiosity." [Title (publishing). Wikipedia]
The shapes example "Design elements - Education title blocks" was created using the ConceptDraw PRO diagramming and vector drawing software extended with the Education Infographics solition from the area "Business Infographics" in ConceptDraw Solution Park.
Titles
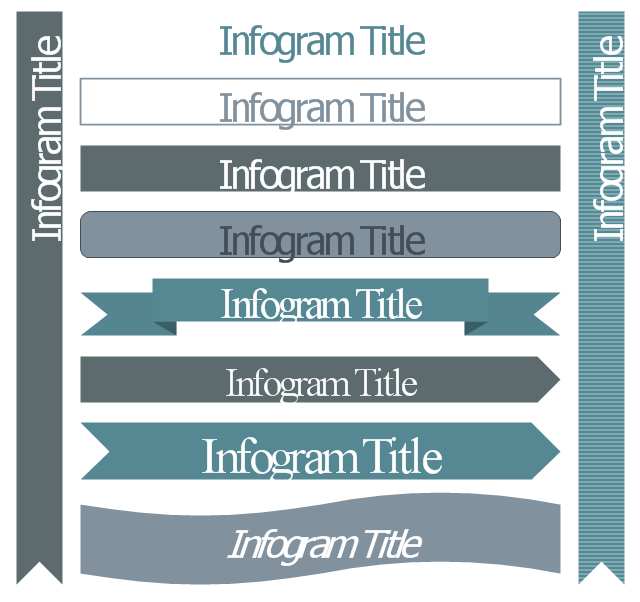
The vector stencils library "Management title blocks" contains 10 shapes: rectangle, rounded rectangle, ribbon, arrow, flag, bookmark.
Use it to design your management infogram.
The titles example "Design elements - Management title blocks" was created using the ConceptDraw PRO diagramming and vector drawing software extended with the Management Infographics solition from the area "Business Infographics" in ConceptDraw Solution Park.
Infographic titles
The vector stencils library "Mac OS X Lion user interface" contains 52 UI design elements.
Use it for designing Mac OS X Lion graphic user interface (GUI) of software for Apple computers in the ConceptDraw PRO diagramming and vector drawing software extended with the Graphic User Interface solution from the Software Development area of ConceptDraw Solution Park.
Use it for designing Mac OS X Lion graphic user interface (GUI) of software for Apple computers in the ConceptDraw PRO diagramming and vector drawing software extended with the Graphic User Interface solution from the Software Development area of ConceptDraw Solution Park.
Title Bar

Title Bar Inactive

Window

Window Inactive

Window Title Bar

Window Title Bar (Inactive)
-mac-os-x-lion-user-interface---vector-stencils-library.png--diagram-flowchart-example.png)
Full Screen Button

Exit Full Screen Button

Window without Bar

Window (Narrow Toolbar)
-mac-os-x-lion-user-interface---vector-stencils-library.png--diagram-flowchart-example.png)
Window Inactive (Narrow Toolbar)
-mac-os-x-lion-user-interface---vector-stencils-library.png--diagram-flowchart-example.png)
Panel (Hud Window)
-mac-os-x-lion-user-interface---vector-stencils-library.png--diagram-flowchart-example.png)
Panel (Hud Window) (Inactive)
-(inactive)-mac-os-x-lion-user-interface---vector-stencils-library.png--diagram-flowchart-example.png)
Box 1

Box 2

Field

List View 1

List View 2

Scroll Bar Vertical

Scroll Bar Horizontal

Main Menu

Menu Bar

Menu

Vertical Line

Horizontal Line

Apple Menu

Arrow mark
Combo Box

Pop Up Menu

Text Field

Count Button

Search Field

Check Box

Check Box

Group of Check Boxes

Radio Button

Radio Button

Group of Radio Buttons

Linear Slider (round thumb)
-mac-os-x-lion-user-interface---vector-stencils-library.png--diagram-flowchart-example.png)
Linear Slider (directional thumb)
-mac-os-x-lion-user-interface---vector-stencils-library.png--diagram-flowchart-example.png)
Circular Slider

Color Well

Relevance Indicator

Rating Indicator

Indeterminate Progress Bar

Determinate Progress Bar

Continuous Capacity Indicator

Discrete Capacity Indicator

Discrete Capacity Indicator (yellow)
-mac-os-x-lion-user-interface---vector-stencils-library.png--diagram-flowchart-example.png)
Discrete Capacity Indicator (red)
-mac-os-x-lion-user-interface---vector-stencils-library.png--diagram-flowchart-example.png)
Asynchronous Progress Indicator

Circular Progress Indicator

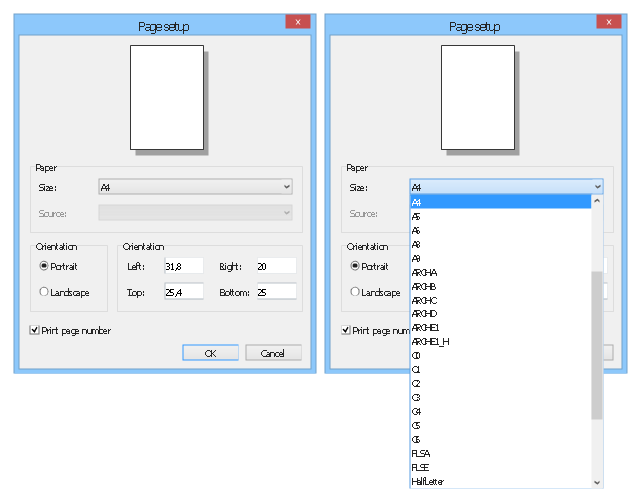
This example illustrates usage of dersign elements in the graphic user interface (GUI) of Windows 8 application Page setup dialog.
"Page Setup Dialog ... allows the user to set the following attributes of the printed page: (1) The paper type (envelope, legal, letter, and so on). (2) The paper source (manual feed, tractor feed, sheet feeder, and so on). (3) The page orientation (portrait or landscape). (4) The width of the page margins." [msdn.microsoft.com/ en-us/ library/ windows/ desktop/ ms646962%28v=vs.85%29.aspx]
The sample "Page setup dialog" was created using the ConceptDraw PRO diagramming and vector drawing software extended with the Windows 8 User Interface solution from the Software Development area of ConceptDraw Solution Park.
Dialog box
The vector stencils library "Stakeholder icons" contains 41 icons for drawing onion diagrams.
Use it with ConceptDraw PRO software to design your stakeholder diagrams.
"A stakeholder or stakeholders, as defined in its first usage in a 1963 internal memorandum at the Stanford Research Institute, are "those groups without whose support the organization would cease to exist." The theory was later developed and championed by R. Edward Freeman in the 1980s. Since then it has gained wide acceptance in business practice and in theorizing relating to strategic management, corporate governance, business purpose and corporate social responsibility (CSR). A corporate stakeholder can affect or be affected by the actions of a business as a whole.
The term has been broadened to include anyone who has an interest in a matter." [Stakeholder (corporate). Wikipedia]
The icon set example "Design elements - Stakeholder icons" is included in the Stakeholder Onion Diagrams solution from the Management area of ConceptDraw Solution Park.
Icon set for onion diagrams
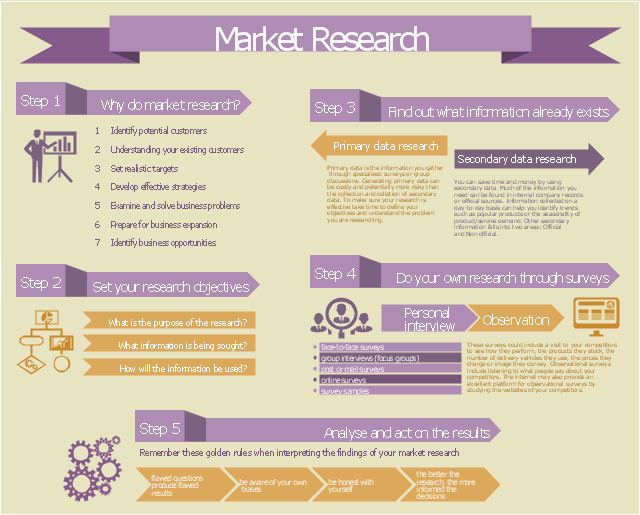
This example of marketing infogram was created on the base of web page "Market research" from the website of West Australian State Government agency Small Business Development Corporation (SBDC).
"Market research is a key part of developing your marketing strategy. It’s about collecting information to give you an insight into your customers’ mind so that you understand what they want, how they gather information and where they come from. You can also do market research to get a better idea of market trends and what is happening in your industry sector.
The information you gather and analyse builds the foundation of good business decisions whether it’s deciding what product or service you’ll offer, where your business should be located, how to distribute your products or how you communicate with consumers." [smallbusiness.wa.gov.au/ market-research]
The example "Marketing Infographics - Market Research" was created using the ConceptDraw PRO diagramming and vector drawing software extended with the Marketing Infographics solition from the area "Business Infographics" in ConceptDraw Solution Park.
Marketing infogram
 Illustration
This solution extends ConceptDraw PRO v9.4, allowing you to make professional-looking documents, presentations and websites illustrated with color, scalable vector clip art and shapes, regardless of drawing skills.
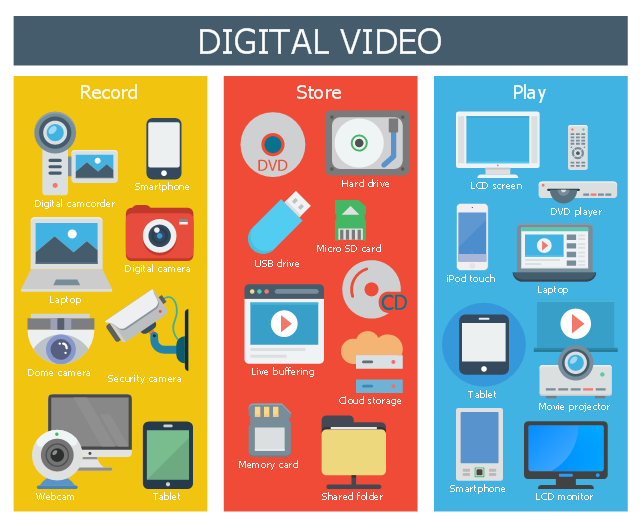
This infographic sample shows digital video devices for video record, store and play.
"Digital video is a representation of moving visual images in the form of encoded digital data. ...
QuickTime, Apple Computer's architecture for time-based and streaming data formats appeared in June, 1991. Initial consumer-level content creation tools were crude, requiring an analog video source to be digitized to a computer-readable format. While low-quality at first, consumer digital video increased rapidly in quality, first with the introduction of playback standards such as MPEG-1 and MPEG-2 (adopted for use in television transmission and DVD media), and then the introduction of the DV tape format allowing recordings in the format to be transferred direct to digital video files (containing the same video data recorded on the transferred DV tape) on an editing computer and simplifying the editing process, allowing non-linear editing systems (NLE) to be deployed cheaply and widely on desktop computers with no external playback/ recording equipment needed, save for the computer simply requiring a FireWire port to interface to the DV-format camera or VCR. The widespread adoption of digital video has also drastically reduced the bandwidth needed for a high-definition video signal (with HDV and AVCHD, as well as several commercial variants such as DVCPRO-HD, all using less bandwidth than a standard definition analog signal) and tapeless camcorders based on flash memory and often a variant of MPEG-4." [Digital video. Wikipedia]
The infographic example "Digital video" was created using the ConceptDraw PRO diagramming and vector drawing software extended with the Audio, Video, Media solution from the Illustrations area of ConceptDraw Solution Park.
Infographic
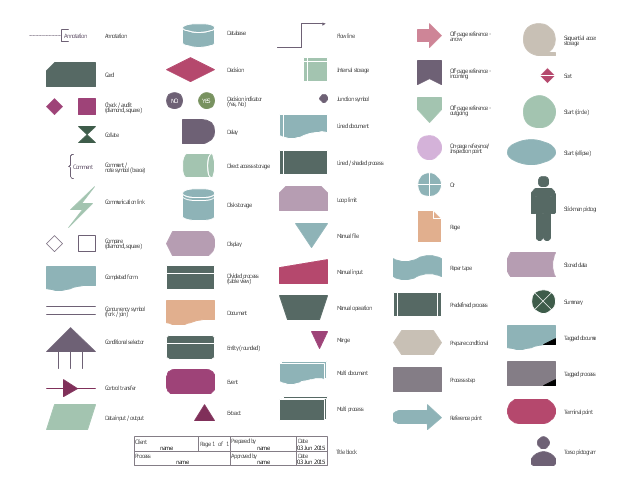
The vector stencils library "Sales flowchart" contains 62 flow chart symbols.
Use it to design your sales flowcharts, workflow diagrams and process charts by the ConceptDraw PRO diagramming and vector drawing software.
"Flowcharts are used in designing and documenting simple processes or programs. Like other types of diagrams, they help visualize what is going on and thereby help understand a process, and perhaps also find flaws, bottlenecks, and other less-obvious features within it. There are many different types of flowcharts, and each type has its own repertoire of boxes and notational conventions. The two most common types of boxes in a flowchart are:
(1) a processing step, usually called activity, and denoted as a rectangular box,
(2) a decision, usually denoted as a diamond." [Flowchart. Wikipedia]
The shapes example "Design elements - Sales flowchart" is included in the Sales Flowcharts solution from the Marketing area of ConceptDraw Solution Park.
Flowchart symbols
The vector stencils library "HR flowchart" contains 62 flow chart symbols.
Use it to design your HR flowcharts, workflow diagrams and process charts by the ConceptDraw PRO diagramming and vector drawing software.
"Flowcharts are used in designing and documenting simple processes or programs. Like other types of diagrams, they help visualize what is going on and thereby help understand a process, and perhaps also find flaws, bottlenecks, and other less-obvious features within it. There are many different types of flowcharts, and each type has its own repertoire of boxes and notational conventions. The two most common types of boxes in a flowchart are:
(1) a processing step, usually called activity, and denoted as a rectangular box,
(2) a decision, usually denoted as a diamond." [Flowchart. Wikipedia]
The shapes example "Design elements - HR flowchart" is included in the HR Flowcharts solution from the Management area of ConceptDraw Solution Park.
Flowchart symbols
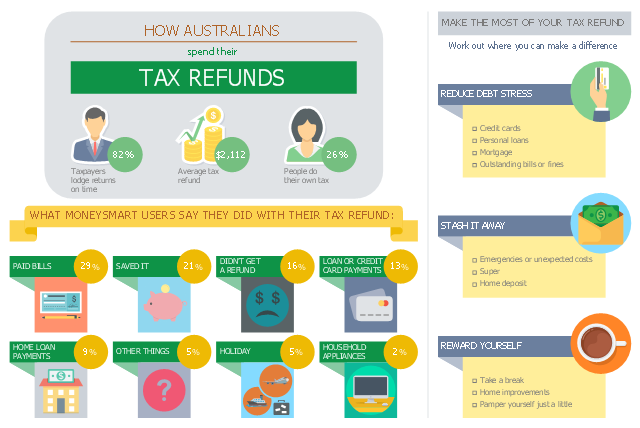
This business infographic sample shows the average tax refund and how people say they spent last year's tax refund. It was designed on the base of the infographic "How Australians spend their tax refunds" from the MoneySmart website of the Australian Securities and Investments Commission (ASIC).
[moneysmart.gov.au/ managing-your-money/ income-tax/ how-australians-spend-their-tax-refunds]
"A tax refund or tax rebate is a refund on taxes when the tax liability is less than the taxes paid. Taxpayers can often get a tax refund on their income tax if the tax they owe is less than the sum of the total amount of the withholding taxes and estimated taxes that they paid, plus the refundable tax credits that they claim. (Tax refunds are money given back at the end of the financial year.)" [Tax refund. Wikipedia]
The business infographic example "How Australians spend their tax refunds" was designed using ConceptDraw PRO diagramming and vector drawing software extended with the Business and Finance solution from Illustration area of ConceptDraw Solution Park.
Infographic
Keyboard Shortcuts and Mouse Actions

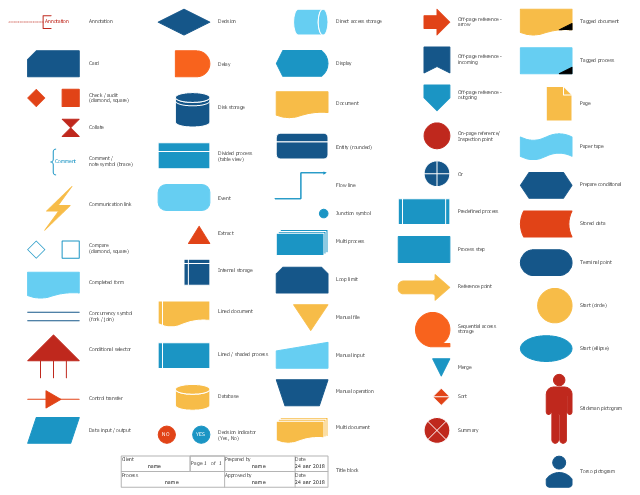
The vector stencils library "Audit flowcharts" contains 31 symbols of audit flow chart diagrams for accounting, financial management, fiscal information tracking, money management, decision flowcharts, and financial inventories.
"A financial audit, or more accurately, an audit of financial statements, is the verification of the financial statements of a legal entity, with a view to express an audit opinion. The audit opinion is intended to provide reasonable assurance, but not absolute assurance, that the financial statements are presented fairly, in all material respects, and/ or give a true and fair view in accordance with the financial reporting framework. The purpose of an audit is to provide an objective independent examination of the financial statements, which increases the value and credibility of the financial statements produced by management, thus increase user confidence in the financial statement, reduce investor risk and consequently reduce the cost of capital of the preparer of the financial statements. ...
Financial audits are typically performed by firms of practicing accountants who are experts in financial reporting. The financial audit is one of many assurance functions provided by accounting firms. Many organizations separately employ or hire internal auditors, who do not attest to financial reports but focus mainly on the internal controls of the organization. External auditors may choose to place limited reliance on the work of internal auditors. Auditing promotes transparency and accuracy in the financial disclosures made by an organization, therefore would likely to reduce of such corporations to conceal unscrupulous dealings.
Internationally, the International Standards on Auditing (ISA) issued by the International Auditing and Assurance Standards Board (IAASB) is considered as the benchmark for audit process. Almost all jurisdictions require auditors to follow the ISA or a local variation of the ISA." [Financial audit. Wikipedia]
The example "Design elements - Audit flowchart" was created using the ConceptDraw PRO diagramming and vector drawing software extended with the Audit Flowcharts solution from the Finance and Accounting area of ConceptDraw Solution Park.
Audit flowchart symbols

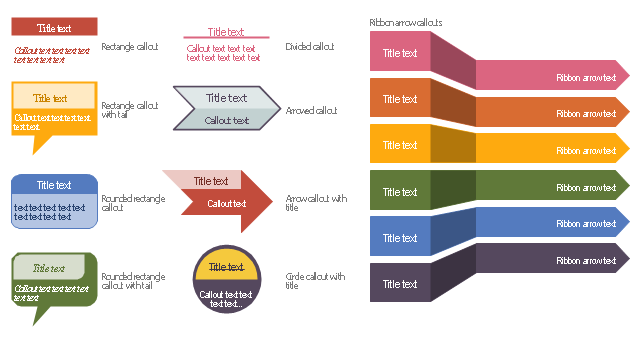
The vector stencils library "Education titled callouts" contains 14 titled callout blocks.
Use it to design your educational infograms.
"In publishing, a call-out or callout is a short string of text connected by a line, arrow, or similar graphic to a feature of an illustration or technical drawing, and giving information about that feature. The term is also used to describe a short piece of text set in larger type than the rest of the page and intended to attract attention.
A similar device in word processing is a special text box with or without a small "tail" that can be pointed to different locations on a document." [Callout. Wikipedia]
The shapes example "Design elements - Education titled callouts" was created using the ConceptDraw PRO diagramming and vector drawing software extended with the Education Infographics solition from the area "Business Infographics" in ConceptDraw Solution Park.
Titled callout blocks
- Design elements - Titles | Design elements - Title blocks | Design ...
- Design elements - Titles | Design elements - Title blocks | Design ...
- Box Titles Design
- Design elements - Management title blocks | Design elements ...
- Design elements - Title blocks | Design elements - Management title ...
- Design elements - Management title blocks | Design elements ...
- Design elements - Management title blocks | Design elements ...
- Hierarchy of laws | Design elements - Title blocks | Design elements ...
- Box For Titles
- Design elements - Tabbed text blocks | Design elements - Text ...
- Hierarchy of laws | Design elements - Tabbed text blocks | Ribbon ...
- Title Text Box Design
- Ribbon interface - Vector stencils library | Design elements ...
- Title Box Vector
- Text Box Design Png
- Callout Title Blocks
- Ribbon Text Box Png
- Design elements - Title blocks
- Ribbon interface - Vector stencils library | Design elements - Tabbed ...
- Design elements - Text blocks