A five level pyramid model of different types of Information Systems based on the information processing requirement of different levels in the organization. The first level represents transaction processing systems to process basic data. The second level represents office support systems to process information in office. The third level represents management information systems to process information by managers. The fourth level represents decision support systems to process explicit knowledge. The fifth level represents executive information systems to process tacit knowledge.
"A Computer(-Based) Information System is essentially an IS using computer technology to carry out some or all of its planned tasks. The basic components of computer based information system are:
(1) Hardware - these are the devices like the monitor, processor, printer and keyboard, all of which work together to accept, process, show data and information.
(2) Software - are the programs that allow the hardware to process the data.
(3) Databases - are the gathering of associated files or tables containing related data.
(4) Networks - are a connecting system that allows diverse computers to distribute resources.
(5) Procedures - are the commands for combining the components above to process information and produce the preferred output.
The first four components (hardware, software, database and network) make up what is known as the information technology platform. Information technology workers could then use these components to create information systems that watch over safety measures, risk and the management of data. These actions are known as information technology services." [Information systems. Wikipedia]
This pyramid diagram was redesigned using the ConceptDraw PRO diagramming and vector drawing software from Wikimedia Commons file Five-Level-Pyramid-model.png. [commons.wikimedia.org/ wiki/ File:Five-Level-Pyramid-model.png]
This file is licensed under the Creative Commons Attribution 3.0 Unported license. [creativecommons.org/ licenses/ by/ 3.0/ deed.en]
The triangle chart example "Information systems types" is included in the Pyramid Diagrams solution from the Marketing area of ConceptDraw Solution Park.
Pyramid diagram

Diagrama de Topologia
 diagram - 3 Tier auto scalable Web application architecture")
ConceptDraw Arrows10 Technology

Use Case Diagrams technology with ConceptDraw PRO

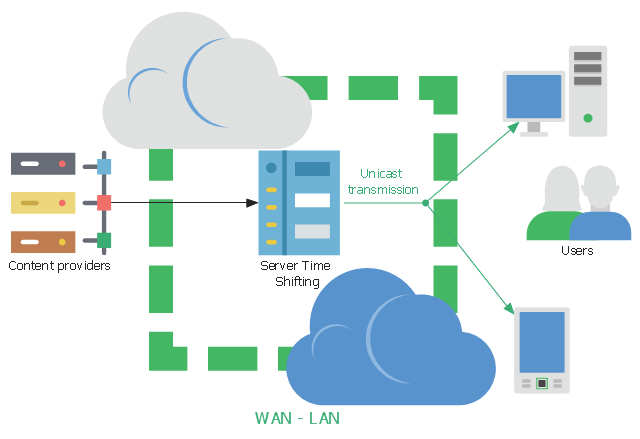
This network diagram sample shows the video on demand (VoD) architecture in a network video recorder (NVR) enviroment. It was designed on the base of Wikimedia Commons file: BaixdemandaArchitecture.png.
[commons.wikimedia.org/ wiki/ File:BaixdemandaArchitecture.png]
This file is licensed under the Creative Commons Attribution-Share Alike 3.0 Unported license. [creativecommons.org/ licenses/ by-sa/ 3.0/ deed.en]
"Video on demand (display) (VOD) are systems which allow users to select and watch/ listen to video or audio content when they choose to, rather than having to watch at a specific broadcast time. IPTV technology is often used to bring video on demand to televisions and personal computers." [Video on demand. Wikipedia]
The network diagram example "VoD architecture in a NVR enviroment" was created using the ConceptDraw PRO diagramming and vector drawing software extended with the Computers and
Communications solution from the Illustration area of ConceptDraw Solution Park.
Network diagram
ConceptDraw Arrows10 Technology

This process flow diagram (PFD) of a typical crude oil distillation unit as used in petroleum crude oil refineries was redrawn from Wikipedia file: Crude Oil Distillation Unit.png. [en.wikipedia.org/ wiki/ File:Crude_ Oil_ Distillation_ Unit.png]
This file is licensed under the Creative Commons Attribution-Share Alike 3.0 Unported license. [creativecommons.org/ licenses/ by-sa/ 3.0/ deed.en]
"An oil refinery or petroleum refinery is an industrial process plant where crude oil is processed and refined into more useful products such as petroleum naphtha, gasoline, diesel fuel, asphalt base, heating oil, kerosene and liquefied petroleum gas. Oil refineries are typically large, sprawling industrial complexes with extensive piping running throughout, carrying streams of fluids between large chemical processing units. In many ways, oil refineries use much of the technology of, and can be thought of, as types of chemical plants. The crude oil feedstock has typically been processed by an oil production plant. There is usually an oil depot (tank farm) at or near an oil refinery for the storage of incoming crude oil feedstock as well as bulk liquid products.
An oil refinery is considered an essential part of the midstream side of the petroleum industry." [en.wikipedia.org/ wiki/ Oil_ refinery]
The process flow diagram (PFD) example "Crude oil distillation" was drawn using the ConceptDraw PRO diagramming and vector drawing software extended with the Chemical and Process Engineering solution from the Chemical and Process Engineering area of ConceptDraw Solution Park.
Process flow diagram (PFD)
-crude-oil-distillation-unit---pfd.png--diagram-flowchart-example.png)
 iPhone User Interface
iPhone User Interface solution extends ConceptDraw PRO v10 software with templates, samples and libraries with large quantity of vector stencils of graphical user interface elements, Apps icons, UI patterns for designing and prototyping of the iOS applic
- Design elements - Technology | Ict Gadgets Png
- Blue Curved Arrow Png Multiple
- ConceptDraw Arrows10 Technology | Diagrama de Topologia ...
- Png Of Group Work
- Vectors Technology Png
- Technology Vector Art Png
- Basic Flowchart Symbols and Meaning | ConceptDraw Arrows10 ...
- Cloud Technology Png Vector
- Educational Technology Tools | Education Information | Education ...
- Technology - Vector stencils library | Video and TV - Vector stencils ...
- Information Technology Risk Vector Png
- Computer Technology Devices Png
- 2d Microphone Png
- Computer Technology Vector Png
- Information Technology Icon Vector Png
- ConceptDraw Arrows10 Technology | Packaging, loading, customs ...
- Explicit Knowledge Png
- Building Technology Symbols Png
- Curv Lines In Png
- Scanning Operator Icon Png