Think. Act. Accomplish.
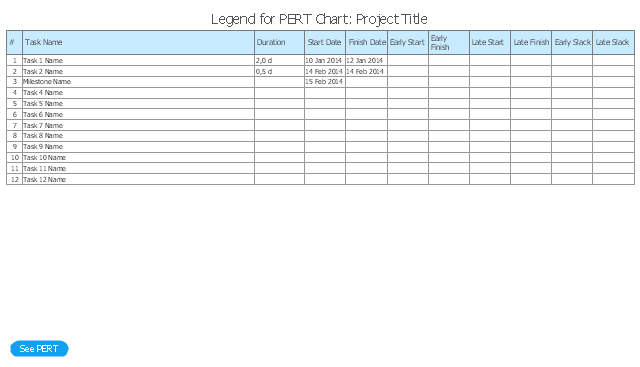
ConceptDraw MINDMAP is ready to provide you with mind mapping tool which can serve as comprehensive productivity tool for your business.The PERT chart shows the logical connections and consequence of a set of tasks. PERT charts the time period for problem solving and the implementation plan for all activities along the critical path. The PERT chart is also known as a precedence diagram or project network diagram.
"The Program (or Project) Evaluation and Review Technique, commonly abbreviated PERT, is a statistical tool, used in project management, that is designed to analyze and represent the tasks involved in completing a given project. ...
PERT is a method to analyze the involved tasks in completing a given project, especially the time needed to complete each task, and to identify the minimum time needed to complete the total project.
PERT was developed primarily to simplify the planning and scheduling of large and complex projects. ...
A network diagram can be created by hand or by using diagram software. There are two types of network diagrams, activity on arrow (AOA) and activity on node (AON). Activity on node diagrams are generally easier to create and interpret." [Program Evaluation and Review Technique. Wikipedia]
The PERT chart is one of the Seven Management and Planning Tools (7 MP tools, Seven New Quality Tools).
The PERT chart template for the ConceptDraw PRO diagramming and vector drawing software is included in the solution "Seven Management and Planning Tools" from the Management area of ConceptDraw Solution Park.
This example was created on the base of the figure from the website of the Iowa State University Center for Excellence in Learning and Teaching.
"Fishbone.
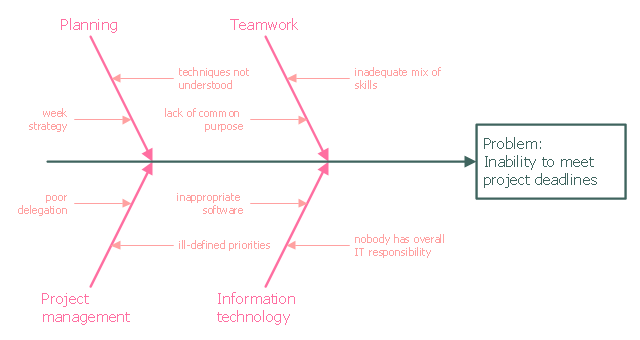
What: The fishbone technique uses a visual organizer to identify the possible causes of a problem.
Benefits: This technique discourages partial or premature solutions and demonstrates the relative importance of, and interactions between, different parts of a problem.
How: On a broad sheet of paper, draw a long arrow horizontally across the middle of the page pointing to the right. Label the arrowhead with the title of the issue to be explained. This is the "backbone" of the "fish." Draw "spurs" from this "backbone" at about 45 degrees, one for every likely cause of the problem that the group can think of; and label each. Sub-spurs can represent subsidiary causes. The group considers each spur/ sub-spur, taking the simplest first, partly for clarity but also because a simple explanation may make more complex ones unnecessary. Ideally, the fishbone is redrawn so that position along the backbone reflects the relative importance of the different parts of the problem, with the most important at the head." [celt.iastate.edu/ creativity/ techniques.html]
The fishbone diagram example "Inability to meet project deadlines" was created using the ConceptDraw PRO diagramming and vector drawing software extended with the Fishbone Diagrams solution from the Management area of ConceptDraw Solution Park.
Applications
Use ConceptDraw MINDMAP for creative thinking, planning, organization, problem solving, presentations, decision making, note taking, team brainstorming and other tasks.ConceptDraw MINDMAP: Brainstorming, Mind Mapping for macOS and Windows
ConceptDraw MINDMAP is a powerful business and personal productivity software application that provides visual organization and access to information for individuals and organizations.- Gantt charts for planning and scheduling projects | Program ...
- Construction Project Chart Examples | Program Evaluation and ...
- PERT chart - Template | Program Evaluation and Review Technique ...
- Program Evaluation and Review Technique (PERT) with ...
- PERT chart - Project management plan | Program Evaluation and ...
- Program Evaluation and Review Technique (PERT) with ...
- CORRECTIVE ACTIONS PLANNING. PERT Chart | Program ...
- Critical Path Method in ConceptDraw PROJECT | Program ...
- Project Plan Software Development Example
- Critical Path Method in ConceptDraw PROJECT | Program ...
- Program Management And Project Management
- Ice Hockey Diagram – Deke Technique | Collaboration in a Project ...
- PM Easy | Program Evaluation and Review Technique (PERT) with ...
- Example Of Project Plan Diagrams
- Project Management Net Work Diagram Activity On Node
- Activities In A Project Management Software With Example Diagram
- Critical Path Method in ConceptDraw PROJECT | Program ...
- Draw Project Management Nodes
- Gant Chart in Project Management | Gantt charts for planning and ...
- Activity Network (PERT) Chart | Program Evaluation and Review ...


