"A target market is a group of customers that the business has decided to aim its marketing efforts and ultimately its merchandise towards. A well-defined target market is the first element to a marketing strategy. The marketing mix variables of product, place (distribution), promotion and price are the four elements of a marketing mix strategy that determine the success of a product in the marketplace." [Target market. Wikipedia]
"An onion diagram is a kind of chart that shows the dependencies among parts of an organization or process. The chart displays items in concentric circles, where the items in each ring depend on the items in the smaller rings. ...
The Onion Diagram is able to show layers of a complete system in a few circles. Each of the circles is able to represent a component that is dependent upon the component on the inside of it shown by the circle inside of it. The main concept of the diagram is shown by the center circle of the diagram. This chart is used due to the fact that it has a clear visual representation that is easy to read, and it has a strong visual impact." [Onion diagram. Wikipedia]
This onion diagram (target diagram) example "Target market" was created using the ConceptDraw PRO diagramming and vector drawing software extended with the Target and Circular Diagrams solution from the Marketing area of ConceptDraw Solution Park.
www.conceptdraw.com/ solution-park/ marketing-target-and-circular-diagrams
Onion diagram
Target Diagram

Circle Spoke Diagram Template

 Target and Circular Diagrams
This solution extends ConceptDraw DIAGRAM software with samples, templates and library of design elements for drawing the Target and Circular Diagrams.
Business diagrams & Org Charts with ConceptDraw DIAGRAM


2 Circle Venn Diagram. Venn Diagram Example

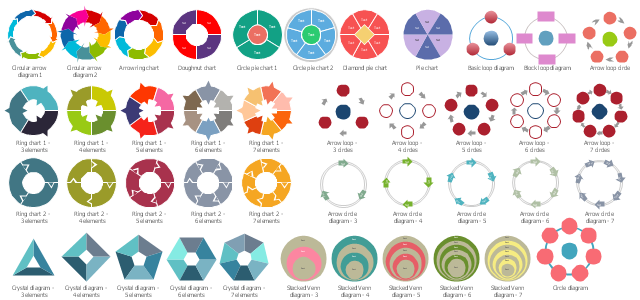
The vector stencils library "Circular diagrams" contains 42 templates of circular diagrams: circular arrow diagram, circular motion diagram, arrow ring chart, doughnut chart (donut chart), circle pie chart, diamond pie chart, circle diagram, pie chart, ring chart, loop diagram, block loop diagram, arrow loop circle, crystal diagram, triangular diagram, diamond diagram, pentagon diagram, hexagon diagram, heptagon diagram, cycle diagram (cycle chart), stacked Venn diagram (onion diagram), arrow circle diagram.
Use these shapes to illustrate your marketing and sales documents, presentations, webpages and infographics in the ConceptDraw PRO diagramming and vector drawing software extended with the Target and Circular Diagrams solution from the Marketing area of ConceptDraw Solution Park.
www.conceptdraw.com/ solution-park/ marketing-target-and-circular-diagrams
Circular arrow diagram 1
Circular arrow diagram 2
Arrow ring chart
Doughnut chart

Diamond pie chart

Pie chart

Circle diagram

Circle pie chart 2

Circle pie chart 1

Ring chart 1 - 3 elements

Ring chart 1 - 4 elements

Ring chart 1 - 5 elements

Ring chart 1 - 6 elements

Ring chart 1 - 7 elements

Ring chart 2 - 3 elements

Ring chart 2 - 4 elements

Ring chart 2 - 5 elements

Ring chart 2 - 6 elements

Ring chart 2 - 7 elements

Crystal diagram - 3 elements

Crystal diagram - 4 elements

Crystal diagram - 5 elements

Crystal diagram - 6 elements

Crystal diagram - 7 elements

Stacked Venn diagram - 4

Stacked Venn diagram - 5

Stacked Venn diagram - 6

Stacked Venn diagram - 7

Basic loop diagram

Block loop diagram

Arrow loop circle
Arrow loop - 3 circles
Arrow loop - 4 circles
Arrow loop - 5 circles
Arrow loop - 6 circles
Arrow loop - 7 circles
Arrow circle diagram - 3
Arrow circle diagram - 4
Stacked Venn diagram - 3

Arrow circle diagram - 5
Arrow circle diagram - 6
Arrow circle diagram - 7
 Circle-Spoke Diagrams
Examples of subject areas that are well suited to this approach are marketing, business, products promotion, process modeling, market, resource, time, and cost analysis. Circle-Spoke Diagrams are successfully used in presentations, conferences, management documents, magazines, reportages, reviews, reports, TV, and social media.
The vector stencils library "Circular diagrams" contains 42 templates of circular diagrams: circular arrow diagram, circular motion diagram, arrow ring chart, doughnut chart (donut chart), circle pie chart, diamond pie chart, circle diagram, pie chart, ring chart, loop diagram, block loop diagram, arrow loop circle, crystal diagram, triangular diagram, diamond diagram, pentagon diagram, hexagon diagram, heptagon diagram, cycle diagram (cycle chart), stacked Venn diagram (onion diagram), arrow circle diagram.
The example of marketing diagrams templates "Design elements - Circular diagrams" for the ConceptDraw PRO diagramming and vector drawing software is included the Target and Circular Diagrams solution from the Marketing area of ConceptDraw Solution Park.
www.conceptdraw.com/ solution-park/ marketing-target-and-circular-diagrams
Circular diagrams templates
 Venn Diagrams
Venn Diagrams are actively used to illustrate simple set relationships in set theory and probability theory, logic and statistics, mathematics and computer science, linguistics, sociology, and marketing. Venn Diagrams are also often used to visually summarize the status and future viability of a project.
 Basic Venn Diagrams
This solution extends ConceptDraw DIAGRAM (or later) with samples, templates, and libraries of vector stencils for drawing Venn Diagrams.
Concept Maps

Examples of Flowcharts, Org Charts and More


This onion diagram sample was created on the base of the figure "Social Ecological Model (SEM)" illustrating the webpage "Cultural Competence" from the US Centers for Disease Control and Prevention (CDC) website.
"Why consider cultural competence?
It is important to communicate effectively to both the disparately affected population(s) of interest as well as other key stakeholders at the community, state, and national levels.
The diagram of the Social Ecological Model (SEM) ... depicts how health behaviors of an individual (inner oval) are influenced by the interpersonal, organizational, community, and public policy contexts and environment in which that person exists. Cultural context resides in the interpersonal band, making it a critical consideration when designing any communication plan. All obesity prevention communications should take the culture (e.g., language, thoughts, communications, actions, customs, beliefs, values, and institutions of racial, ethnic, religious, or social groups) of the target population into consideration to be effective. Interventions that successfully achieve this goal demonstrate cultural competence - behaviors, attitudes, and policies that come together in a system, agency, or among professionals to enable people to work effectively in a cross-cultural situation."
[cdc.gov/ obesity/ health_ equity/ culturalRelevance.html]
The onion diagram example "Social Ecological Model (SEM)" was created using the ConceptDraw PRO diagramming and vector drawing software extended with the Target and Circular Diagrams solution from the Marketing area of ConceptDraw Solution Park.
www.conceptdraw.com/ solution-park/ marketing-target-and-circular-diagrams
Onion diagram
---onion-diagram.png--diagram-flowchart-example.png)
- Venn Diagram | Target market - Onion diagram | Venn Diagrams ...
- Venn Diagrams | Target market - Onion diagram | Circle-Spoke ...
- Marketing Venn Diagram
- Target Diagram | Target and Circular Diagrams | Target market ...
- Target market - Onion diagram
- Target Diagram | Target market - Onion diagram | Target and ...
- Target market | Target market - Onion diagram | Scatter Chart ...
- Market value - Pyramid diagram | Target market - Onion diagram ...
- Target market - Onion diagram | Block diagram - Marketing targeting ...
- Internet marketing professions | Venn Diagram | Venn Diagram ...
- Target Diagram | Target market - Onion diagram | Target market ...
- Competitor Analysis | Target Diagram | Target market - Onion ...
- Organizational Structure Diagram Software | Target market ...
- Target market - Onion diagram
- Target market | Target market - Onion diagram | Target Diagram ...
- Marketing Analysis Diagram | Marketing Diagrams | Flowchart ...
- Daily Schedule Chart | Target Diagram | Business Productivity ...
- Circular diagrams - Vector stencils library | Circular diagrams ...
- Marketing Charts | Marketing Organization Chart | Marketing ...
- Target market - Onion diagram | How to Draw a Circle-Spoke ...