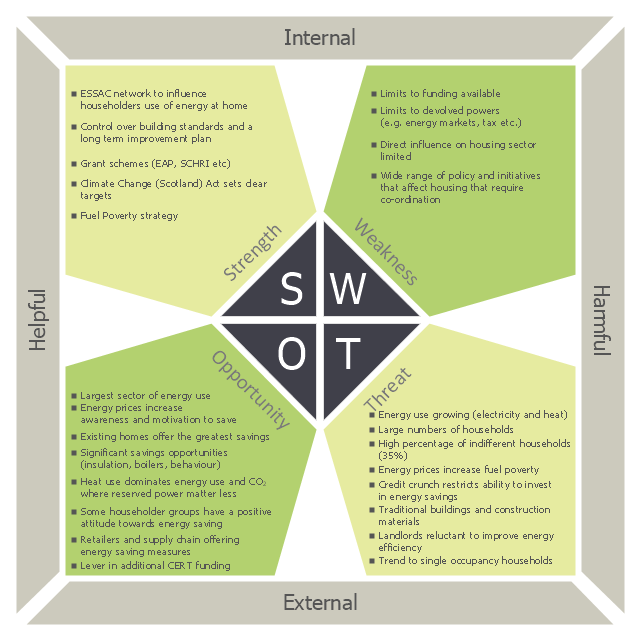
This sample was created on the base of the SWOT matrix illustrating the webpage "SWOT Analysis" of "Scottish Energy Study Volume 4: Issues, Opportunities and Barriers" from the website of the Scottish Government. [scotland.gov.uk/ Publications/ 2009/ 09/ 24094712/ 6]
The diagram example "Domestic sector SWOT" was created using the ConceptDraw PRO diagramming and vector drawing software extended with the SWOT Analysis solution from the Management area of ConceptDraw Solution Park.
The diagram example "Domestic sector SWOT" was created using the ConceptDraw PRO diagramming and vector drawing software extended with the SWOT Analysis solution from the Management area of ConceptDraw Solution Park.
SWOT matrix
 SWOT and TOWS Matrix Diagrams
SWOT and TOWS Matrix Diagrams solution extends ConceptDraw DIAGRAM and ConceptDraw MINDMAP software with features, templates, samples and libraries of vector stencils for drawing SWOT and TOWS analysis matrices and mind maps.
SWOT Template

SWOT Matrix

Pie Donut Chart. Pie Chart Examples

Venn Diagram Template for Word

 UK Map
The Map of UK solution contains collection of professionally designed samples and scalable vector stencil graphics maps, representing the United Kingdom counties, regions and cities. Use the Map of UK solution from ConceptDraw Solution Park as the base fo
 Maps Area
Solutions from the Maps Area of ConceptDraw Solution Park collect templates, samples and libraries of vector stencils for drawing geographical, directional and transport maps.
 Business Package for Management
Package intended for professional who designing and documenting business processes, preparing business reports, plan projects and manage projects, manage organizational changes, prepare operational instructions, supervising specific department of an organization, workout customer service processes and prepare trainings for customer service personal, carry out a variety of duties to organize business workflow.
Education Package
Education Package is a comprehensive set of multifarious graphical solutions from ConceptDraw Solution Park, collected together in help to ConceptDraw DIAGRAM users working in a field of science, education and training, which is aimed at improving the quality of education and helping to design with ease variety of interesting and colorful educational materials, diagrams, charts and maps. Use it to present the information and knowledge in an interesting, clear, structured and simple form to achieve a success in education and pedagogy, to maintain the interest of students and pupils throughout the whole learning process, at the lectures, lessons and even during independent work with additional materials, to contribute to better perception of scientific information by listeners during the conferences and reports.
- SWOT Matrix | Domestic sector SWOT | Scottish Government ...
- SWOT analysis positioning matrix - Template | Domestic sector ...
- Domestic sector SWOT | What is SWOT Analysis in Marketing ...
- SWOT Analysis | What is SWOT Analysis ? | Domestic sector SWOT ...
- SWOT analysis for a small independent bookstore | Accounting ...
- SWOT Analysis | Domestic sector SWOT | SWOT Matrix Template ...
- Software for Creating SWOT Analysis Diagrams | SWOT matrix ...
- SWOT analysis for a small independent bookstore | Website ...
- Swot Analysis Examples | SWOT Analysis | SWOT analysis matrix ...
- SWOT Analysis | SWOT analysis matrix diagram - Instructional ...
- SWOT Sample in Computers | SWOT Analysis | SWOT Matrix ...
- SWOT Analysis | SWOT Analysis | Swot Analysis Examples | Swot ...
- Swot Analysis Example Government
- SWOT Analysis
- Domestic sector SWOT | Geo Mapping Software Examples - World ...
- SWOT Analysis | Swot Analysis Examples | SWOT analysis for a ...
- TOWS Analysis Software | TOWS Analysis | SWOT and TOWS Matrix ...
- Domestic sector SWOT | Pie chart - Domestic energy consumption ...
- Global cumulative energy-related CO2 emissions | Scottish ...
- Cisco Buildings. Cisco icons, shapes, stencils and symbols | SWOT ...