Flow chart Example. Warehouse Flowchart


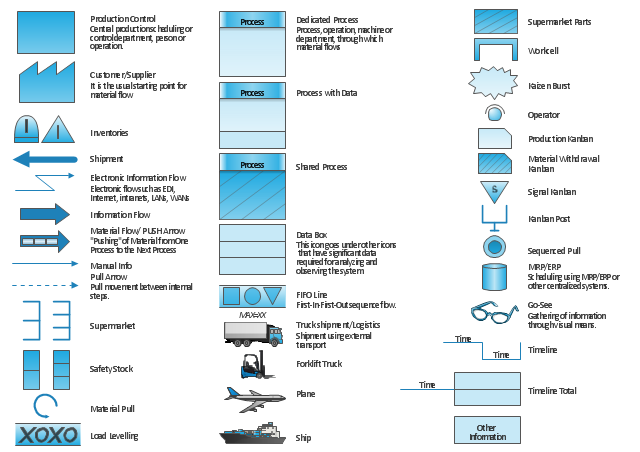
The vector stencils library "Value stream mapping" contains 43 VSM symbols.
Use it for drawing value stream maps in the ConceptDraw PRO diagramming and vector drawing software extended with the Value Stream Mapping solution from the Quality area of ConceptDraw Solution Park.
www.conceptdraw.com/ solution-park/ business-value-stream-mapping
Use it for drawing value stream maps in the ConceptDraw PRO diagramming and vector drawing software extended with the Value Stream Mapping solution from the Quality area of ConceptDraw Solution Park.
www.conceptdraw.com/ solution-park/ business-value-stream-mapping
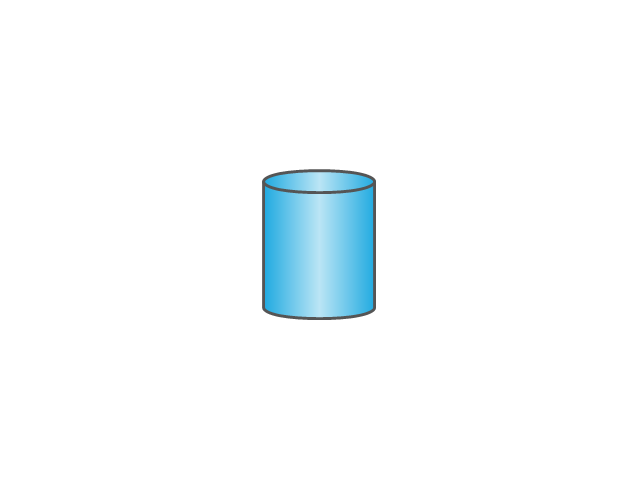
Inventory
Inventory

Information Flow
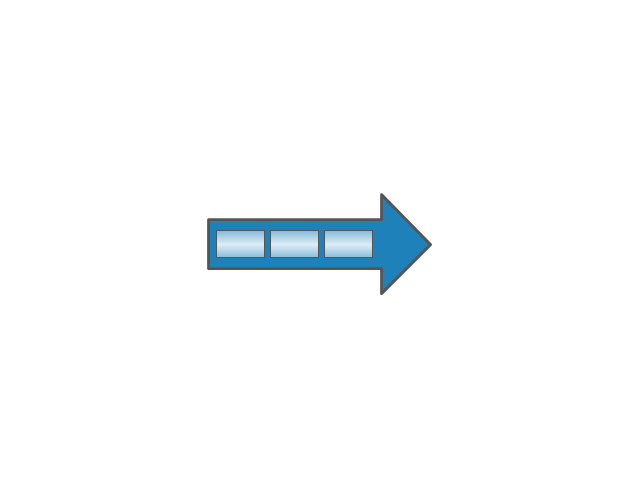
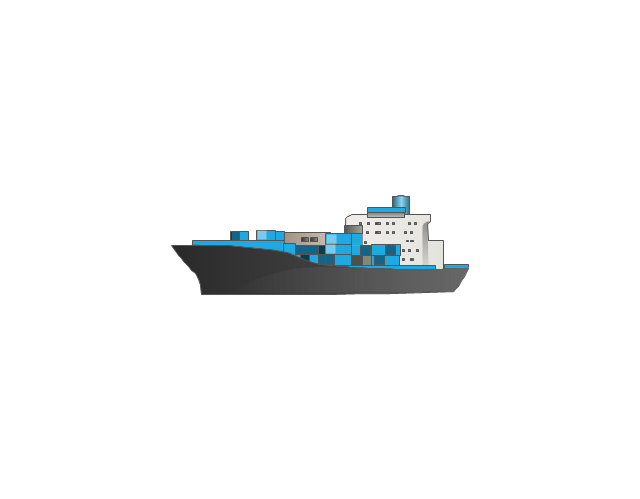
Shipment
Shipment
Material Flow
Material Pull

FIFO Line
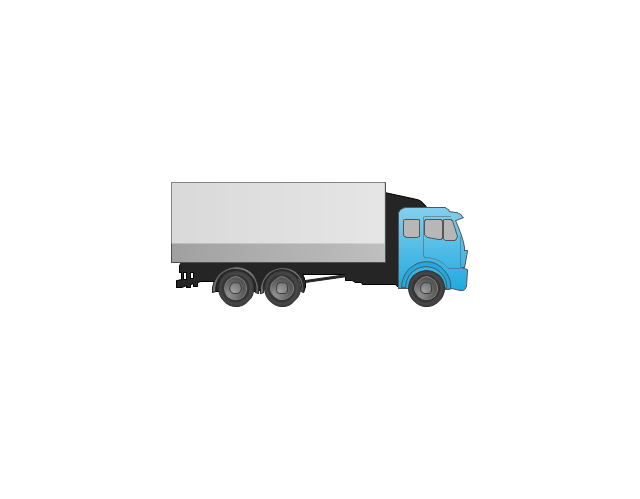
Truck shipment/Logistics
Customer/Supplier
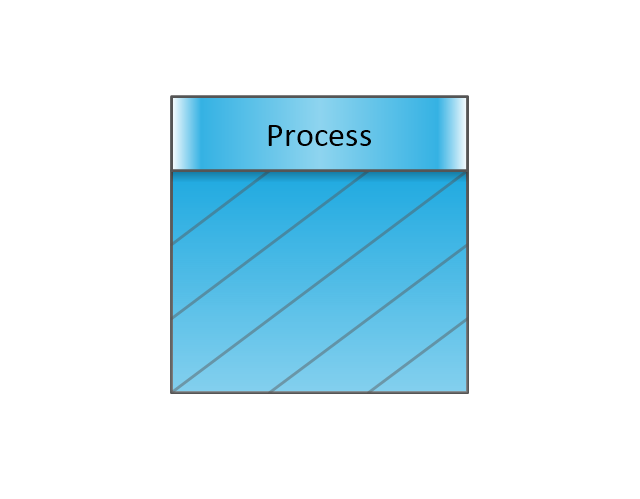
Dedicated Process

Shared Process
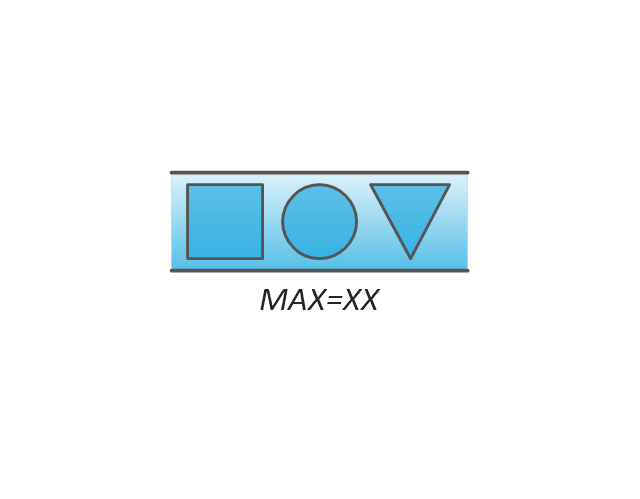
Supermarket Parts
Data Box
Workcell
Kaizen Burst

Operator

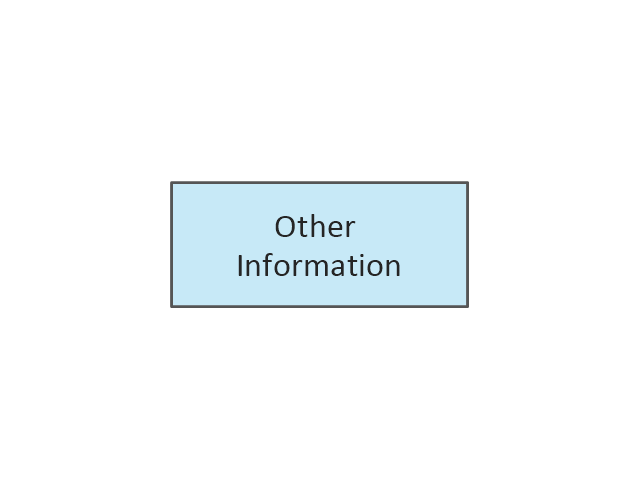
Other
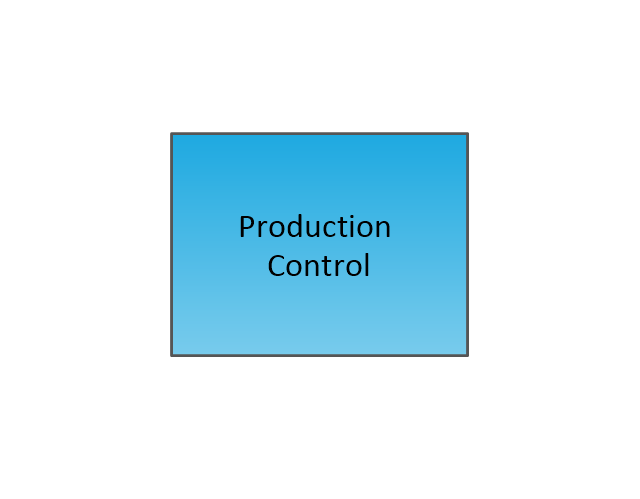
Production Control
Manual Info
Electronic Information Flow
Production Kanban
Withdrawal Kanban

Signal Kanban
Kanban Post
Sequenced Pull
Load Levelling

MRP/ERP
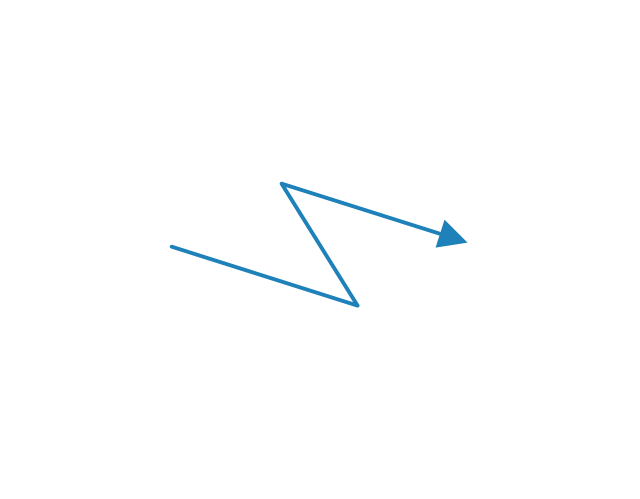
Go-See

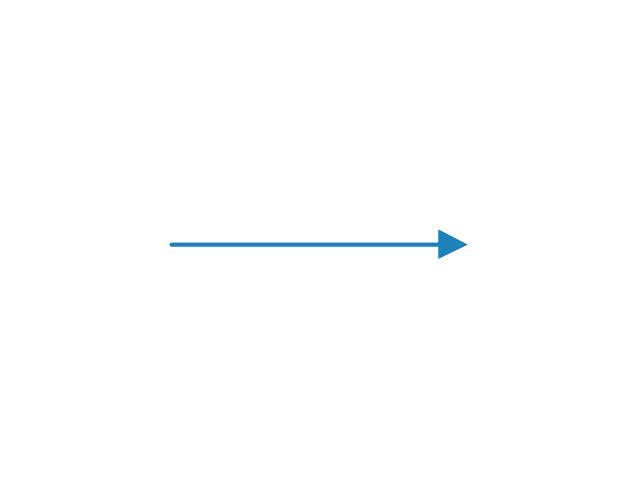
Pull Arrow
Manual Info
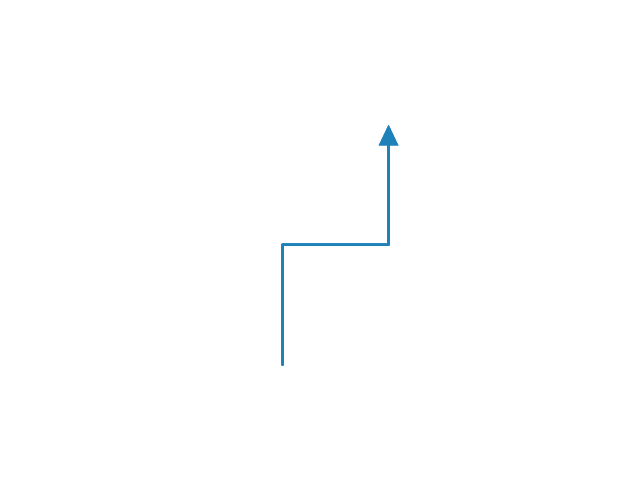
Pull Arrow
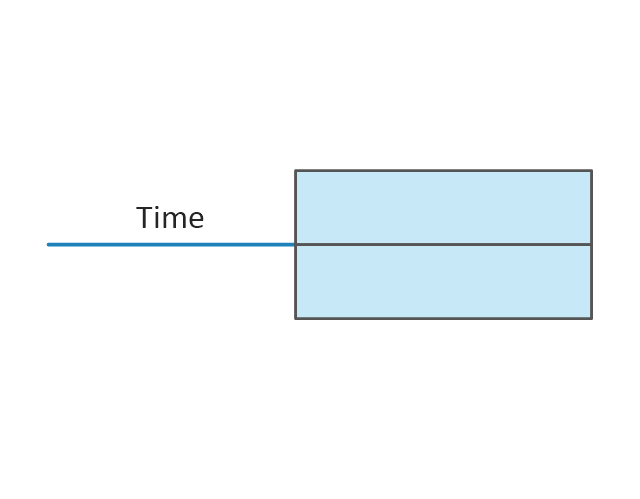
Timeline Total
Ship
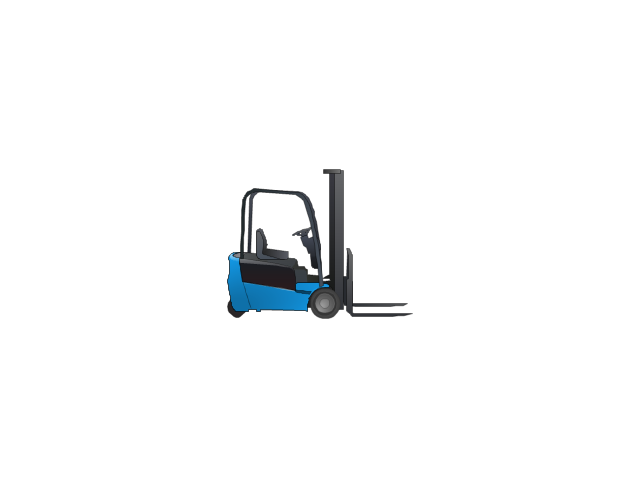
Forklift Truck
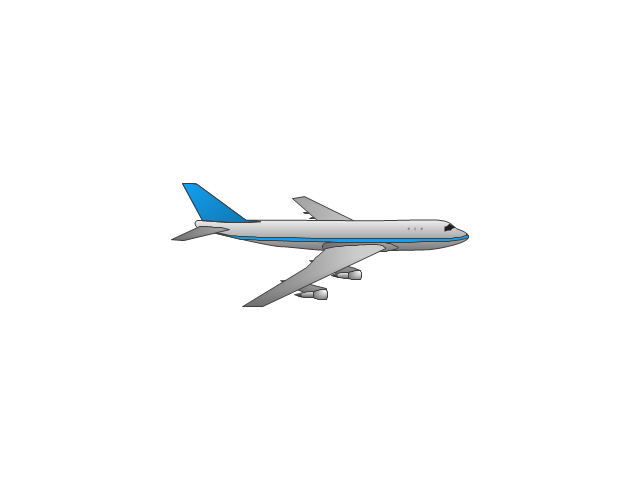
Plane
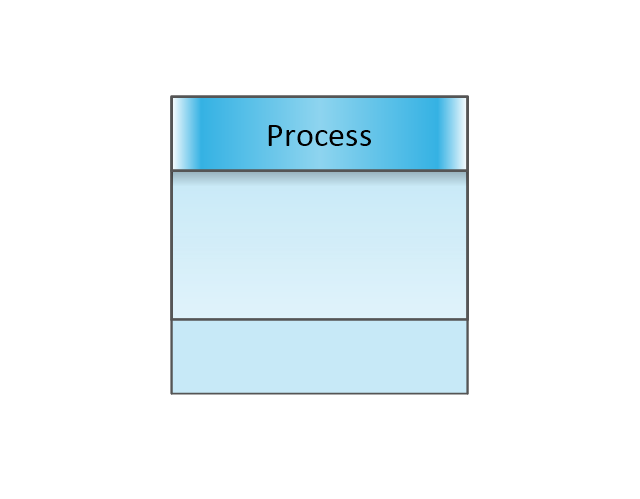
Process with Data
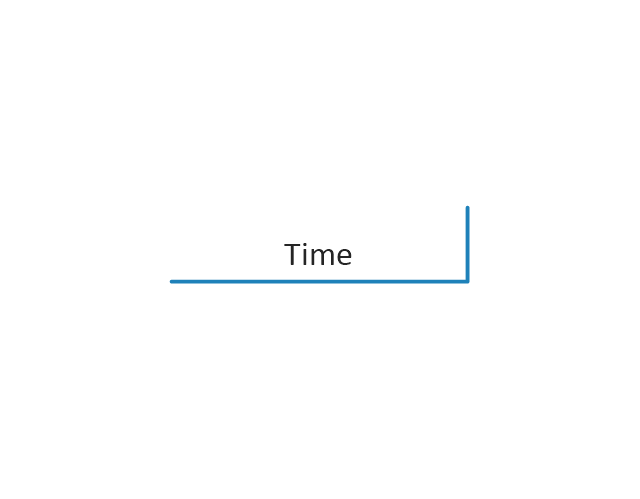
Timeline
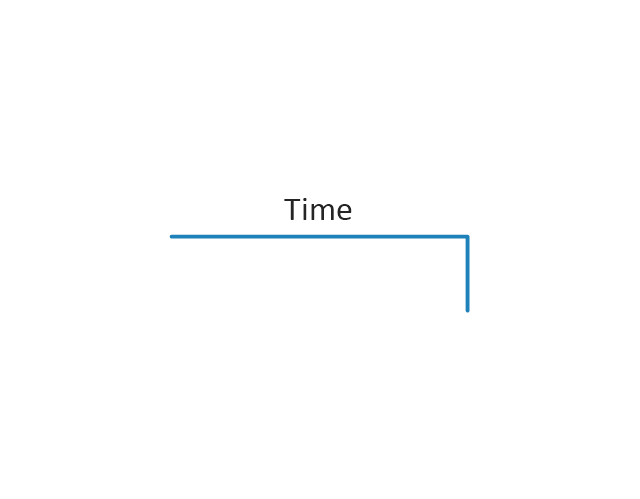
Timeline
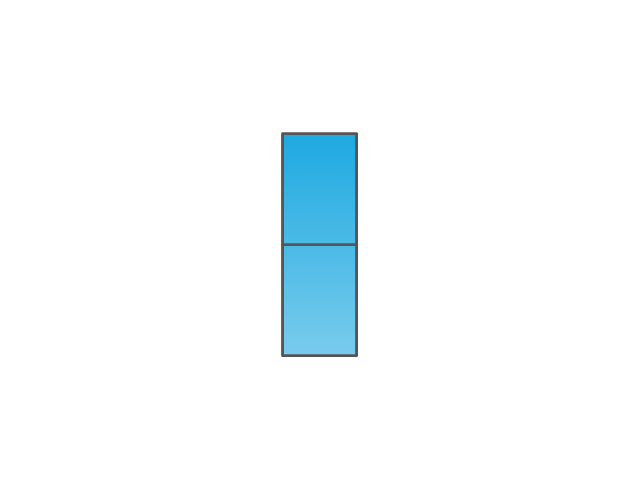
Supermarket, 2

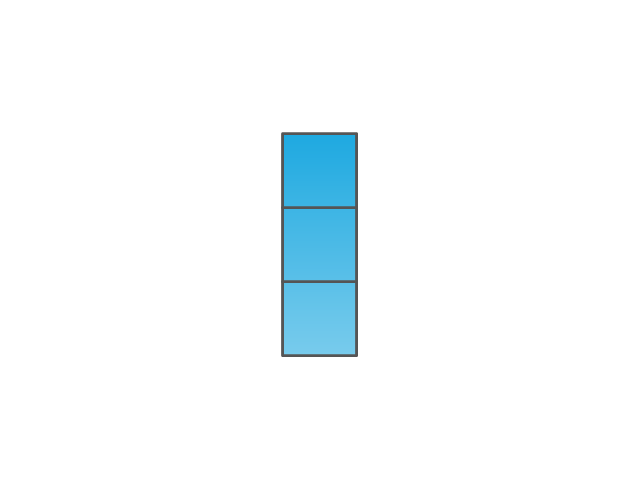
Supermarket, 3

Safety stock, 2
Safety stock, 3
"Value stream mapping usually employs standard symbols to represent items and processes, therefore knowledge of these symbols is essential to correctly interpret the production system problems." [Value stream mapping. Wikipedia]
The vector stencils library Value stream mapping contains 43 symbols for drawing the value stream mapping diagrams using the ConceptDraw PRO diagramming and vector drawing software.
The example "Design elements - Value stream mapping diagram" is included in the Value Stream Mapping solution from the Quality area of ConceptDraw Solution Park.
VSM symbols
The vector stencils library "Value stream mapping" contains 43 VSM symbols.
Use it for drawing value stream maps in the ConceptDraw PRO diagramming and vector drawing software extended with the Value Stream Mapping solution from the Quality area of ConceptDraw Solution Park.
www.conceptdraw.com/ solution-park/ business-value-stream-mapping
Use it for drawing value stream maps in the ConceptDraw PRO diagramming and vector drawing software extended with the Value Stream Mapping solution from the Quality area of ConceptDraw Solution Park.
www.conceptdraw.com/ solution-park/ business-value-stream-mapping
Inventory
Inventory
Information Flow
Shipment
Shipment
Material Flow
Material Pull
FIFO Line
Truck shipment/Logistics
Customer/Supplier
Dedicated Process
Shared Process
Supermarket Parts
Data Box
Workcell
Kaizen Burst
Operator
Other
Production Control
Manual Info
Electronic Information Flow
Production Kanban
Withdrawal Kanban
Signal Kanban
Kanban Post
Sequenced Pull
Load Levelling
MRP/ERP
Go-See
Pull Arrow
Manual Info
Pull Arrow
Timeline Total
Ship
Forklift Truck
Plane
Process with Data
Timeline
Timeline
Supermarket, 2
Supermarket, 3
Safety stock, 2
Safety stock, 3
Process Flowchart


 Cross-Functional Flowcharts
Cross-functional flowcharts are powerful and useful tool for visualizing and analyzing complex business processes which requires involvement of multiple people, teams or even departments. They let clearly represent a sequence of the process steps, the order of operations, relationships between processes and responsible functional units (such as departments or positions).
 Site Plans
Vivid and enticing plan is the starting point in landscape design and site plan design, it reflects the main design idea and gives instantly a vision of the end result after implementation of this plan. Moreover site plan, architectural plan, detailed engineering documents and landscape sketches are obligatory when designing large projects of single and multi-floor buildings.
"Value Stream Map (VSM)
1. A tool used to improve a process by identifying added value and eliminating waste.
2. A process map that follows the value creation process.
A. “strap yourself to the product (or service) and see where you go”
3. A process map with data added.
A. Times: processing, wait, cycle.
B. Quality: number of rejects.
C. Inventory.
D. Resources.
1) Number of people.
2) Space.
3) Distance traveled.
E. Whatever else is useful for analyzing the process." [ocw.mit.edu/ courses/ aeronautics-and-astronautics/ 16-660j-introduction-to-lean-six-sigma-methods-january-iap-2012/ lecture-notes/ MIT16_ 660JIAP12_ 1-6.pdf]
This sample VSM flowchart shows the value stream in a manufacturing, production control and shipping processes.
This value stream mapping diagram example was created using the ConceptDraw PRO diagramming and vector drawing software extended with the Value Stream Mapping solution from the Quality area of ConceptDraw Solution Park.
Value stream mapping
- Supermarket Logistics Flowchart
- Logistic Truck Vector Png
- Site Plans | Supermarket Timeline Implementation
- Logistics Flow Charts | Value stream mapping - Vector stencils ...
- Flow Chart Of Logistics System
- Logistics Flow Charts | Intermodal transport chain | Aerospace and ...
- Logistics - Choreography BPMN 2.0 diagram | Logistics Flow Charts ...
- Process Flowchart | Logistics Flow Charts | How to Make a Logistics ...
- Logistics Flow Charts | Intermodal transport chain | Cross-Functional ...
- Flow Chart Logistic