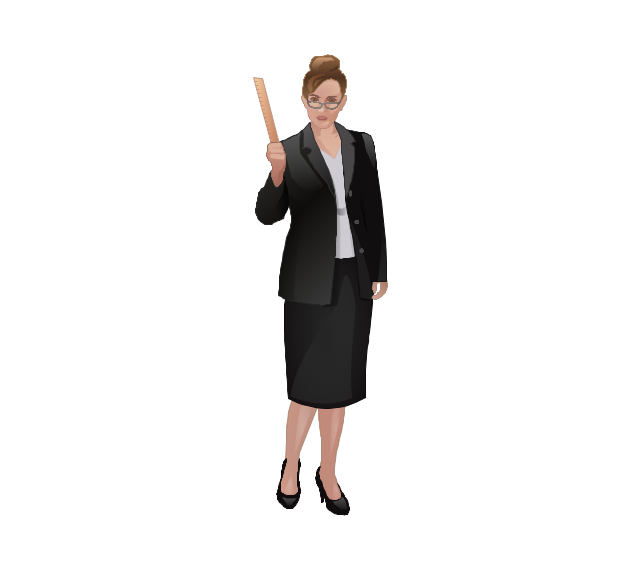
The vector stencils library "Professions" contains 58 people clipart images of different professions you can use in your presentations, illustrations and infographics.
"Electronic clip art is available in several different file formats. It is important for clip art users to understand the differences between file formats so that they can use an appropriate image file and get the resolution and detail results they need.
Clip art file formats are divided into 2 different types: bitmap or vector graphics. ...
In contrast to the grid format of bitmap images, Vector graphics file formats use geometric modeling to describe an image as a series of points, lines, curves, and polygons. Because the image is described using geometric data instead of fixed pixels, the image can be scaled to any size while retaining "resolution independence", meaning that the image can be printed at the highest resolution a printer supports, resulting in a clear, crisp image. Vector file formats are usually superior in resolution and ease of editing as compared to bitmap file formats, but are not as widely supported by software and are not well-suited for storing pixel-specific data such as scanned photographs. In the early years of electronic clip art, vector illustrations were limited to simple line art representations." [Clip art. Wikipedia]
The clip art example "Professions - Vector stencils library" was created using the ConceptDraw PRO diagramming and vector drawing software extended with the People solution from the Illustration area of ConceptDraw Solution Park.
www.conceptdraw.com/ solution-park/ illustrations-people
Builder 1

System administrator

Worker of conveyor

Clerk 1

Clerk 2

Student 2

Student 3

Student 1

Dispatcher 1

Accountant

Gardener

Lawyer

Jurist
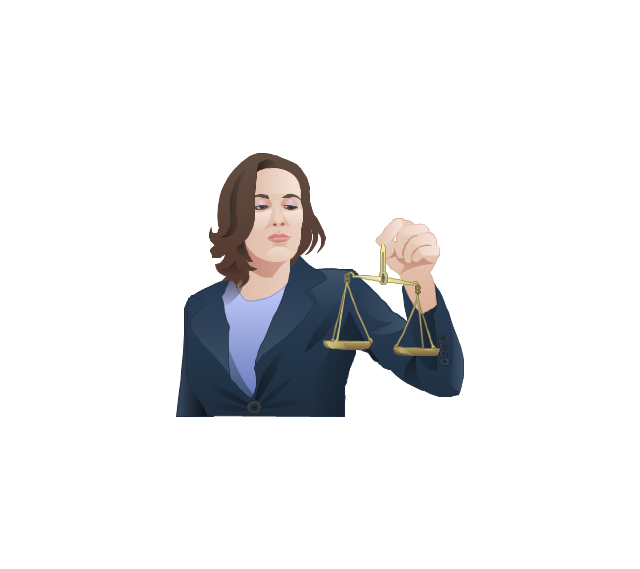
Judge

Consultant

Manager

Director

Programmer

Architect

Pilot

Policeman

Secretary

Security officer

Clerk 3

Musician

Presenter

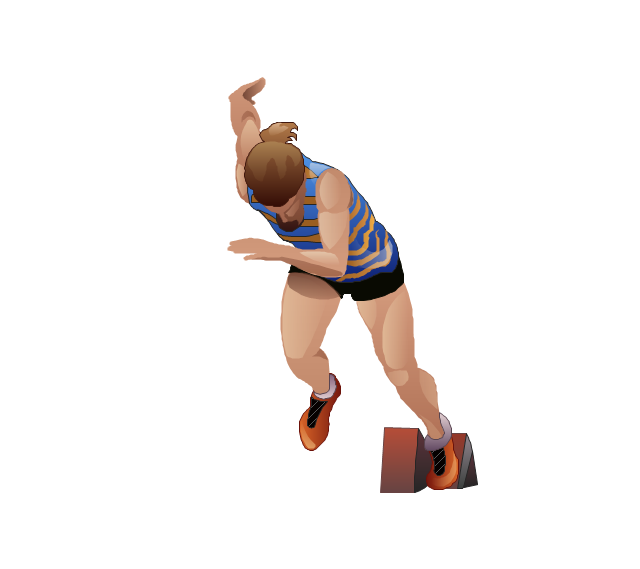
Athlete
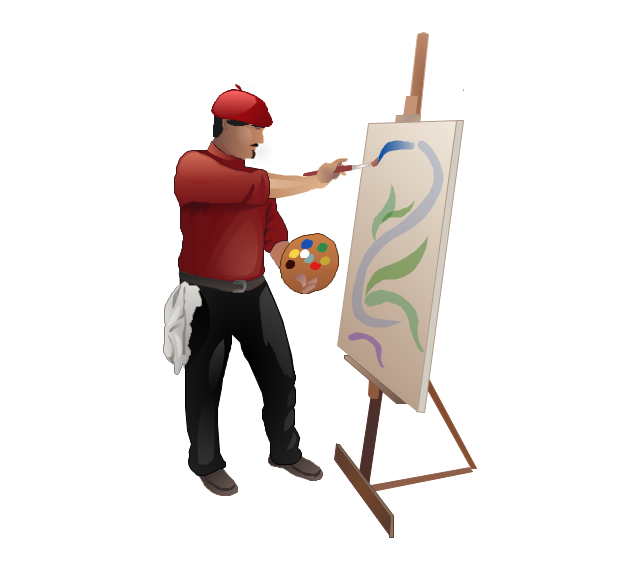
Artist
Announcer

Photographer

Hairdresser

Florist

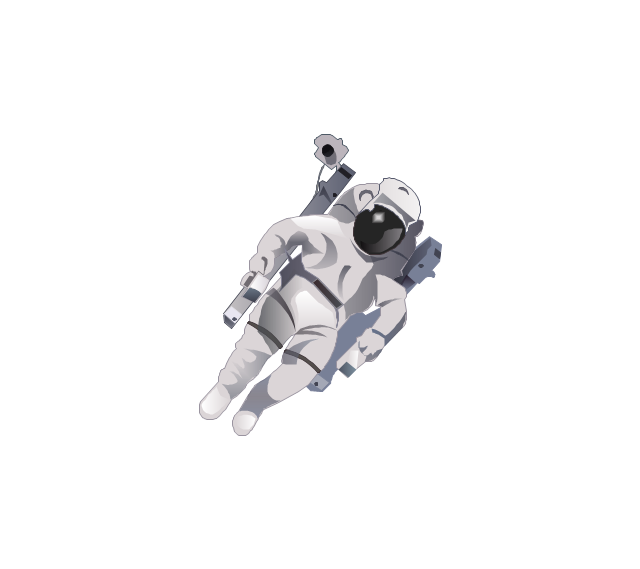
Spaceman
Engineer

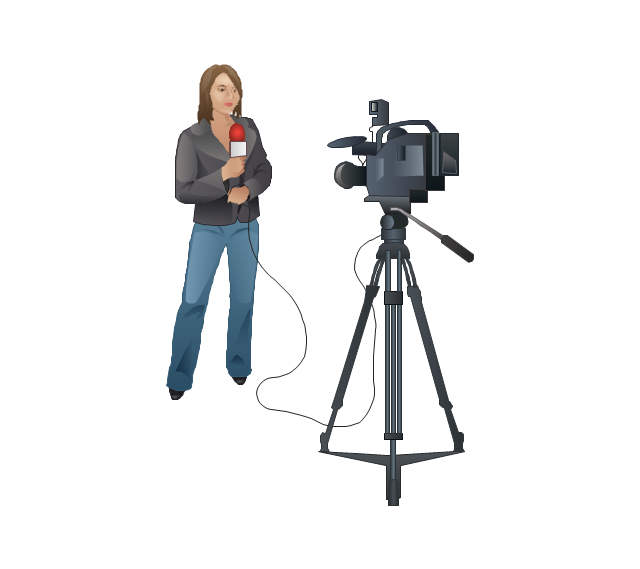
Reporter
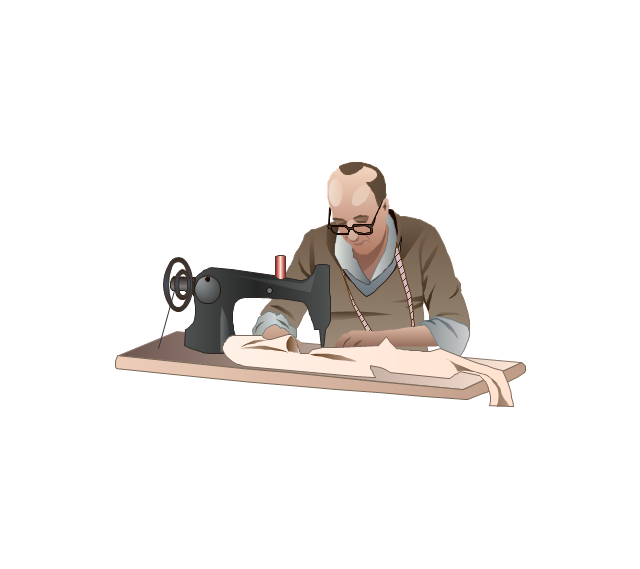
Tailor
Dispatcher 2

Biologist

Chemist

Dentist

Priest

Soldier

Doctor

Driver

Carpenter

Fireman

Seaman

Builder 2

Postman

Miner

Waiter

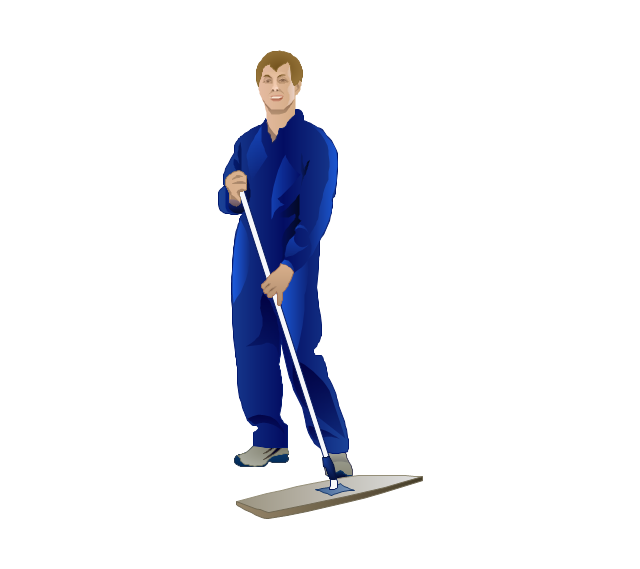
Cleaner
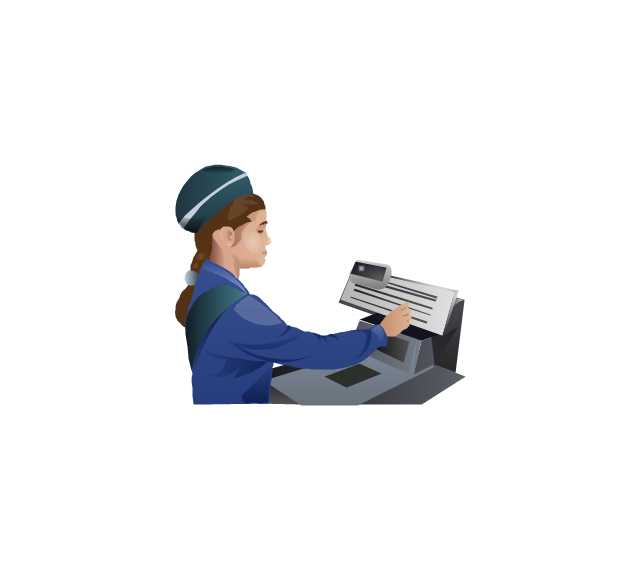
Cashier
Shop assistant

Cook

Flight attendant

Teacher
Hall porter

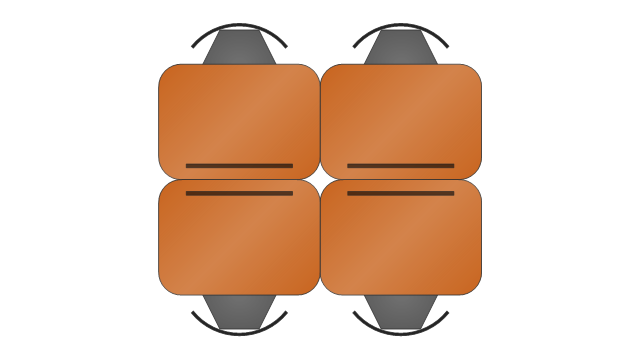
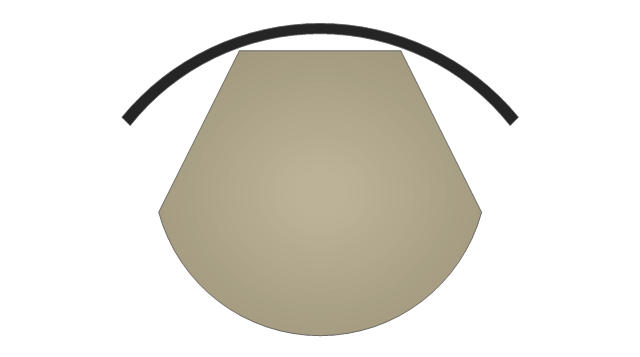
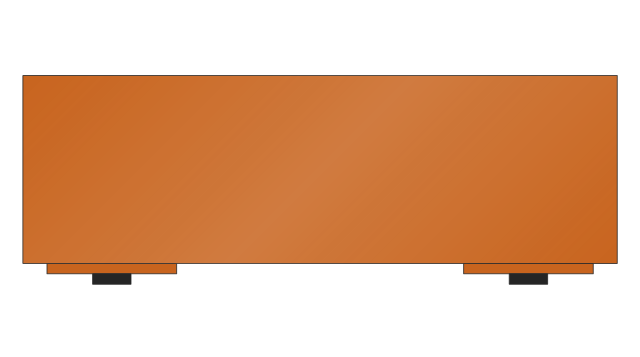
The vector stencils library "School layout" contains 19 symbols of school furniture and educational equipment. Use these shapes for drawing layout floor plans of school classrooms, universiry lecture halls and auditories, training offices in he ConceptDraw PRO diagramming and vector drawing software extended with the School and Training Plans solution from the Building Plans area of ConceptDraw Solution Park.
Single Desk

Double Desk

Student Desk

Student Desk - Group of 2

Student Desk - Group of 4
Lecture Hall Desk

Chair

Curved Back Chair
Teacher's Desk
Bookcase

Podium
Semi-circular Table

Chalkboard

Portable Chalkboard

Screen
Locker
Bank of 5 Lockers
Globe

Papers

The vector stencils library "Application" contains 40 icons of software applications.
Use it to design your computer and telecom illustrations and infographics with ConceptDraw PRO diagramming and vector drawing software.
The vector stencils library "Application" is included in the Computers and Communications solution from the Illustration area of ConceptDraw Solution Park.
Use it to design your computer and telecom illustrations and infographics with ConceptDraw PRO diagramming and vector drawing software.
The vector stencils library "Application" is included in the Computers and Communications solution from the Illustration area of ConceptDraw Solution Park.
Book

Lecture book

E-learning

Education

Graduate

A plus

Student

Position holder

Achievement

Diamond

Present

Balance scale
Law

Atom

Formula
Chemistry

Research

Measuring

Plan

Calendar

Notice pin

Appointment

Tea cup

Journal

Archive

Calculator
Text format

Graphic editor

Vector graphics

Digital art board

Creative

Design

Adaptive

ECG

Forecast book

Presentation

Shopping basket

Platform truck

Printer

Air conditioner

The vector stencils library "Professions" contains 58 people clipart images of different professions you can use in your presentations, illustrations and infographics.
"Electronic clip art is available in several different file formats. It is important for clip art users to understand the differences between file formats so that they can use an appropriate image file and get the resolution and detail results they need.
Clip art file formats are divided into 2 different types: bitmap or vector graphics. ...
In contrast to the grid format of bitmap images, Vector graphics file formats use geometric modeling to describe an image as a series of points, lines, curves, and polygons. Because the image is described using geometric data instead of fixed pixels, the image can be scaled to any size while retaining "resolution independence", meaning that the image can be printed at the highest resolution a printer supports, resulting in a clear, crisp image. Vector file formats are usually superior in resolution and ease of editing as compared to bitmap file formats, but are not as widely supported by software and are not well-suited for storing pixel-specific data such as scanned photographs. In the early years of electronic clip art, vector illustrations were limited to simple line art representations." [Clip art. Wikipedia]
The clip art example "Professions - Vector stencils library" was created using the ConceptDraw PRO diagramming and vector drawing software extended with the People solution from the Illustration area of ConceptDraw Solution Park.
www.conceptdraw.com/ solution-park/ illustrations-people
"Electronic clip art is available in several different file formats. It is important for clip art users to understand the differences between file formats so that they can use an appropriate image file and get the resolution and detail results they need.
Clip art file formats are divided into 2 different types: bitmap or vector graphics. ...
In contrast to the grid format of bitmap images, Vector graphics file formats use geometric modeling to describe an image as a series of points, lines, curves, and polygons. Because the image is described using geometric data instead of fixed pixels, the image can be scaled to any size while retaining "resolution independence", meaning that the image can be printed at the highest resolution a printer supports, resulting in a clear, crisp image. Vector file formats are usually superior in resolution and ease of editing as compared to bitmap file formats, but are not as widely supported by software and are not well-suited for storing pixel-specific data such as scanned photographs. In the early years of electronic clip art, vector illustrations were limited to simple line art representations." [Clip art. Wikipedia]
The clip art example "Professions - Vector stencils library" was created using the ConceptDraw PRO diagramming and vector drawing software extended with the People solution from the Illustration area of ConceptDraw Solution Park.
www.conceptdraw.com/ solution-park/ illustrations-people
Builder 1
System administrator
Worker of conveyor
Clerk 1
Clerk 2
Student 2
Student 3
Student 1
Dispatcher 1
Accountant
Gardener
Lawyer
Jurist
Judge
Consultant
Manager
Director
Programmer
Architect
Pilot
Policeman
Secretary
Security officer
Clerk 3
Musician
Presenter
Athlete
Artist
Announcer
Photographer
Hairdresser
Florist
Spaceman
Engineer
Reporter
Tailor
Dispatcher 2
Biologist
Chemist
Dentist
Priest
Soldier
Doctor
Driver
Carpenter
Fireman
Seaman
Builder 2
Postman
Miner
Waiter
Cleaner
Cashier
Shop assistant
Cook
Flight attendant
Teacher
Hall porter
Entity-Relationship Diagram

The vector stencils library "School layout" contains 19 symbols of school furniture and educational equipment. Use these shapes for drawing layout floor plans of school classrooms, universiry lecture halls and auditories, training offices in he ConceptDraw PRO diagramming and vector drawing software extended with the School and Training Plans solution from the Building Plans area of ConceptDraw Solution Park.
Single Desk
Double Desk
Student Desk
Student Desk - Group of 2
Student Desk - Group of 4
Lecture Hall Desk
Chair
Curved Back Chair
Teacher's Desk
Bookcase
Podium
Semi-circular Table
Chalkboard
Portable Chalkboard
Screen
Locker
Bank of 5 Lockers
Globe
Papers
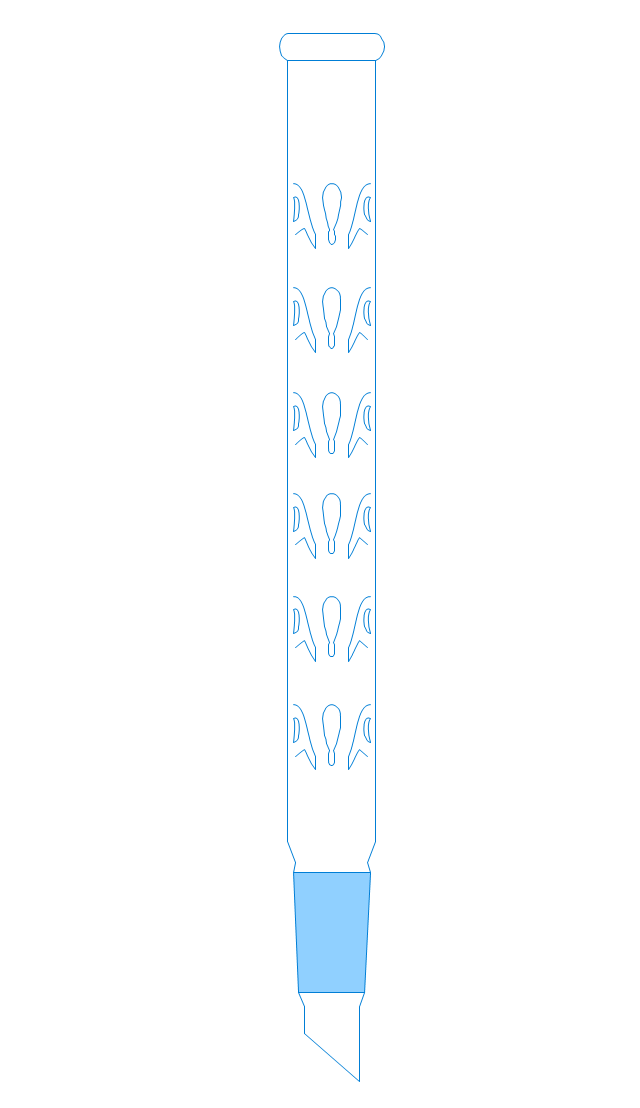
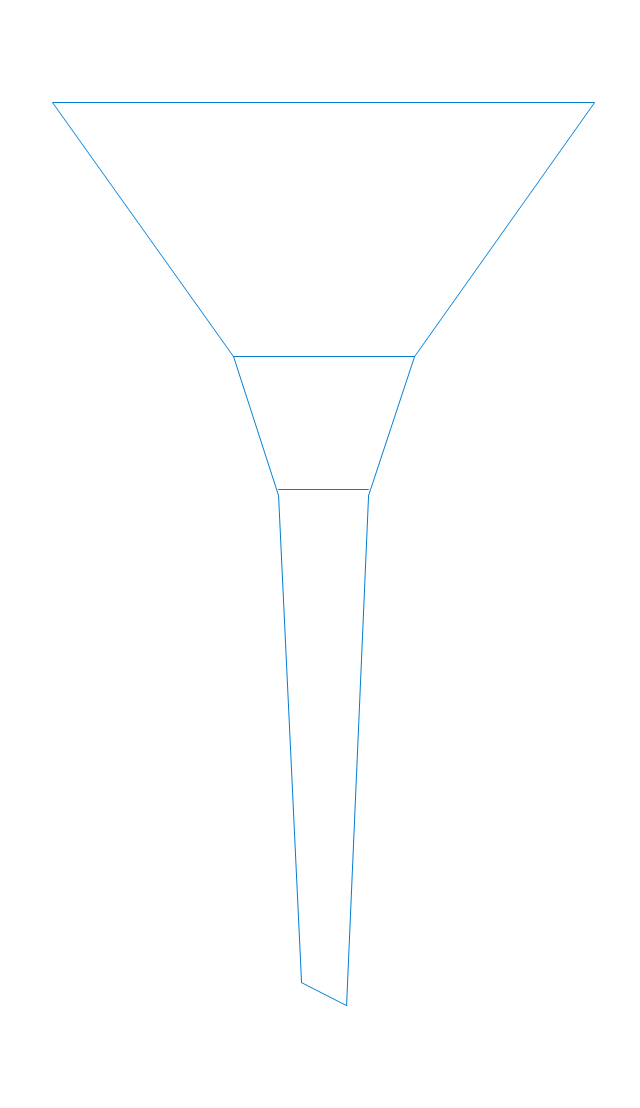
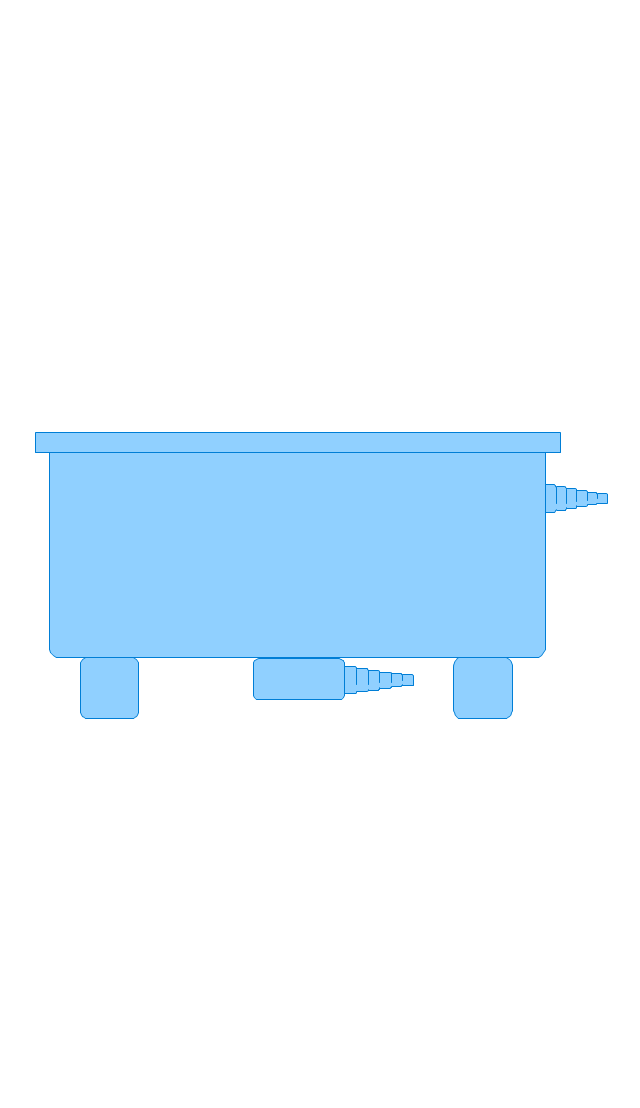
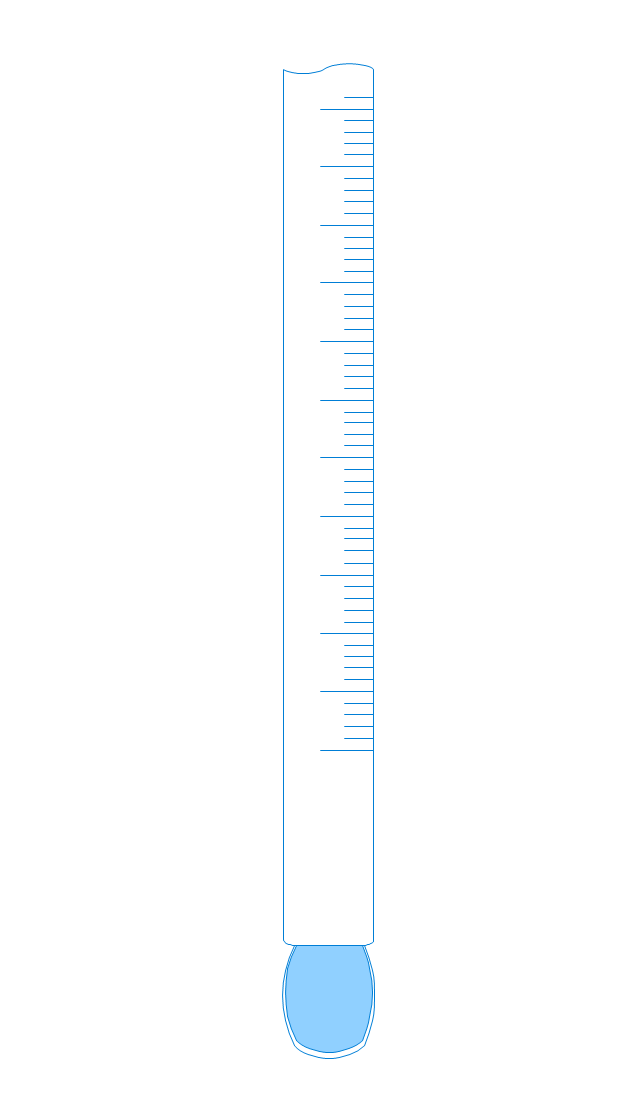
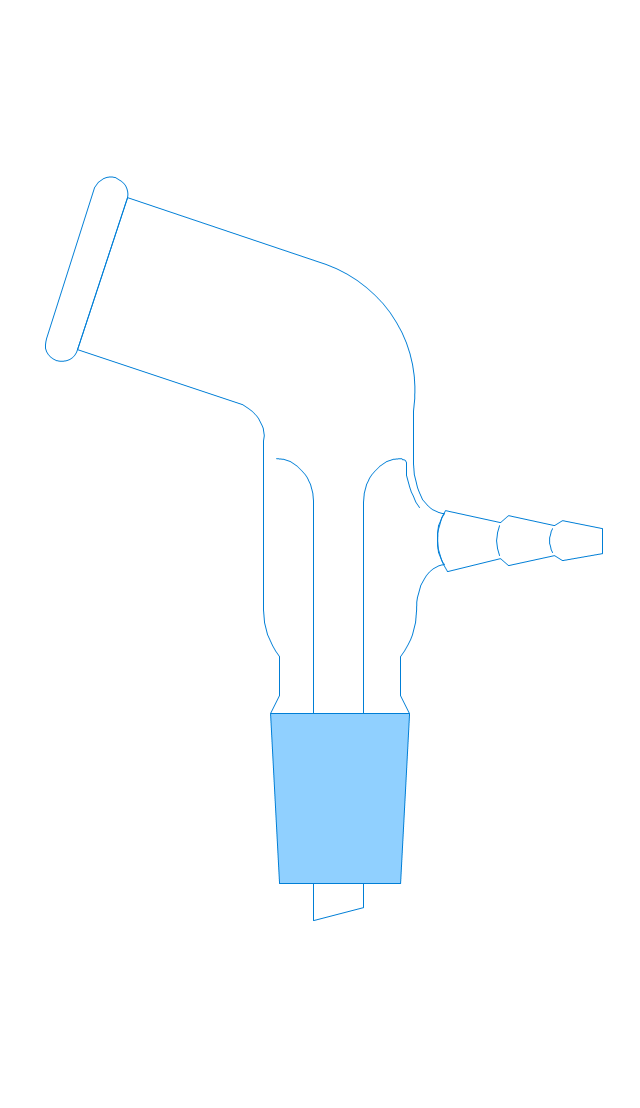
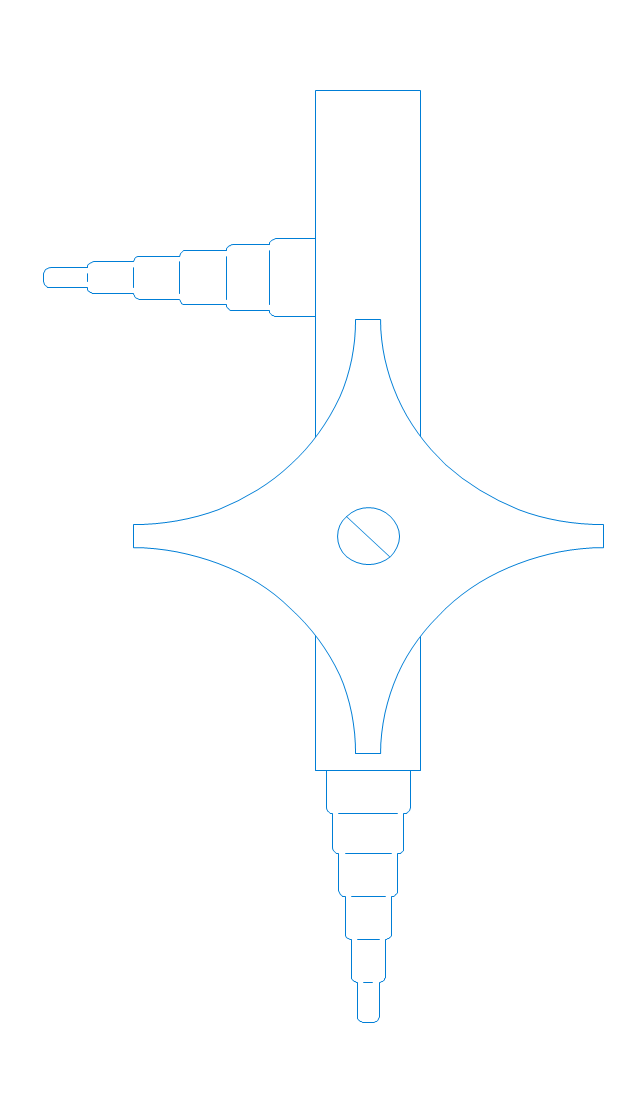
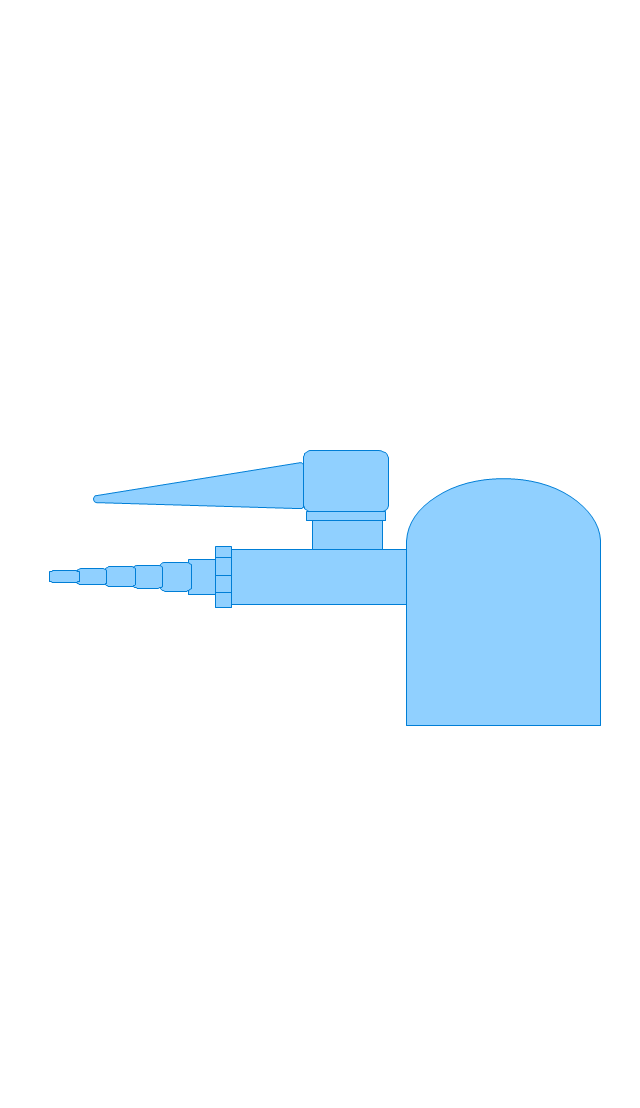
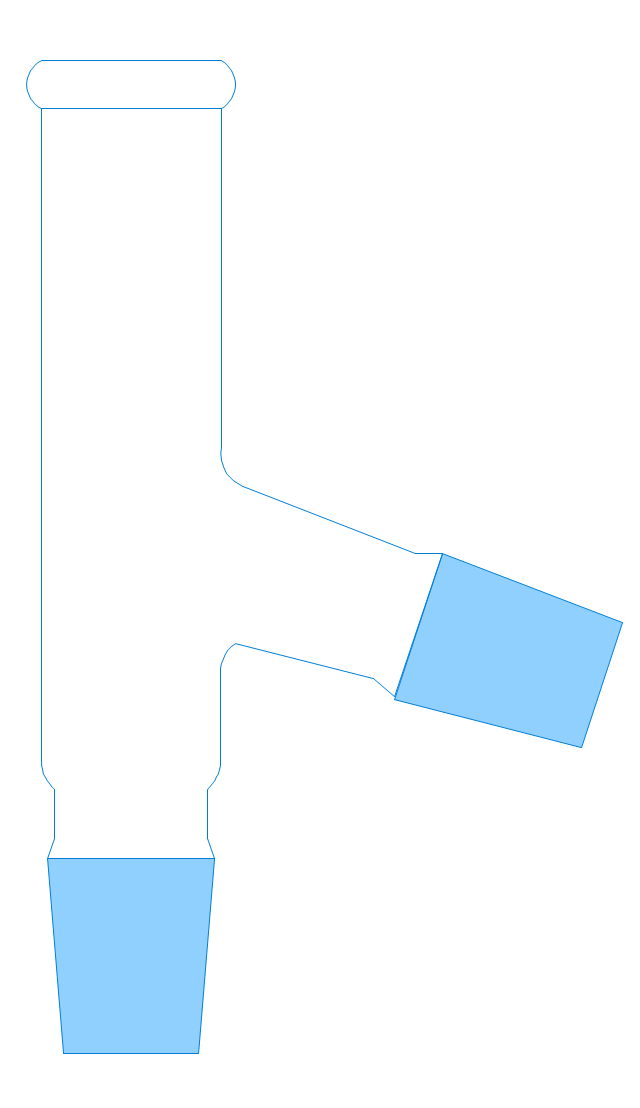
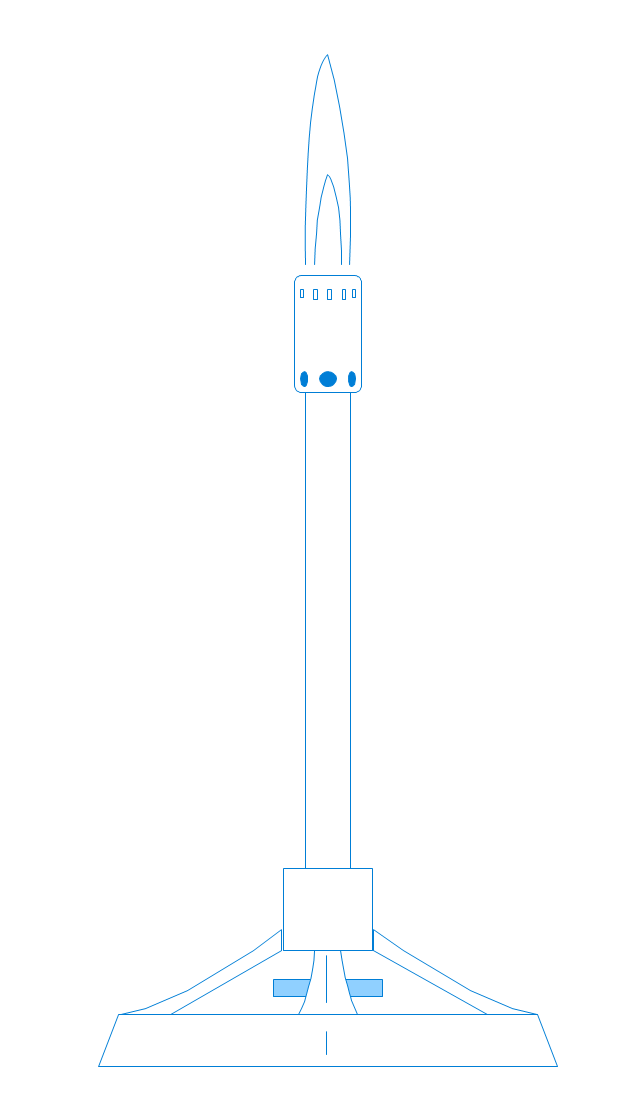
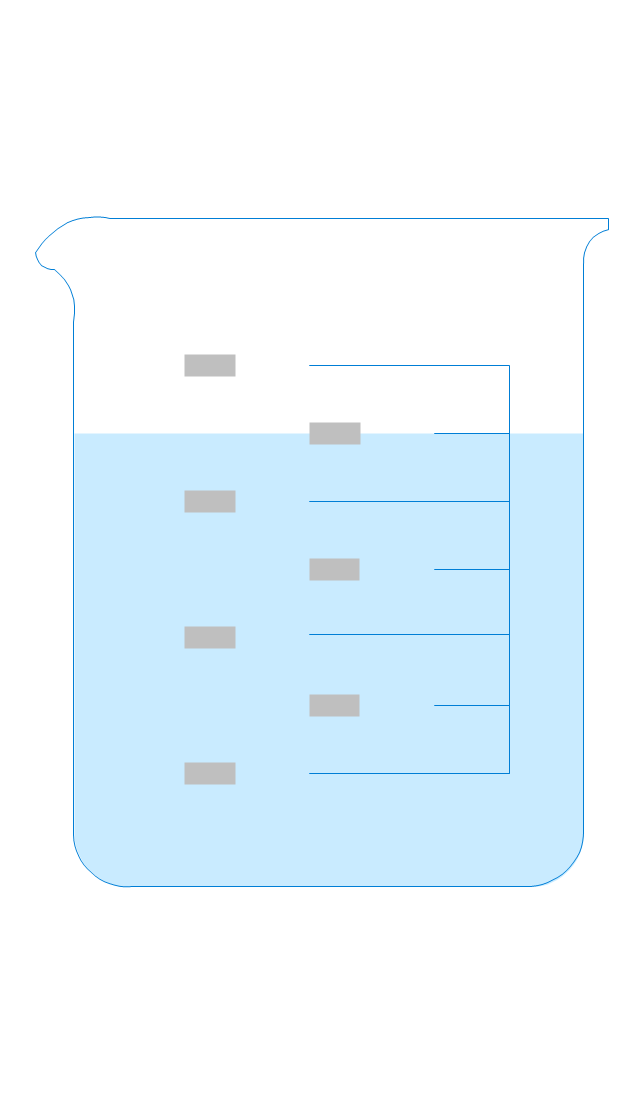
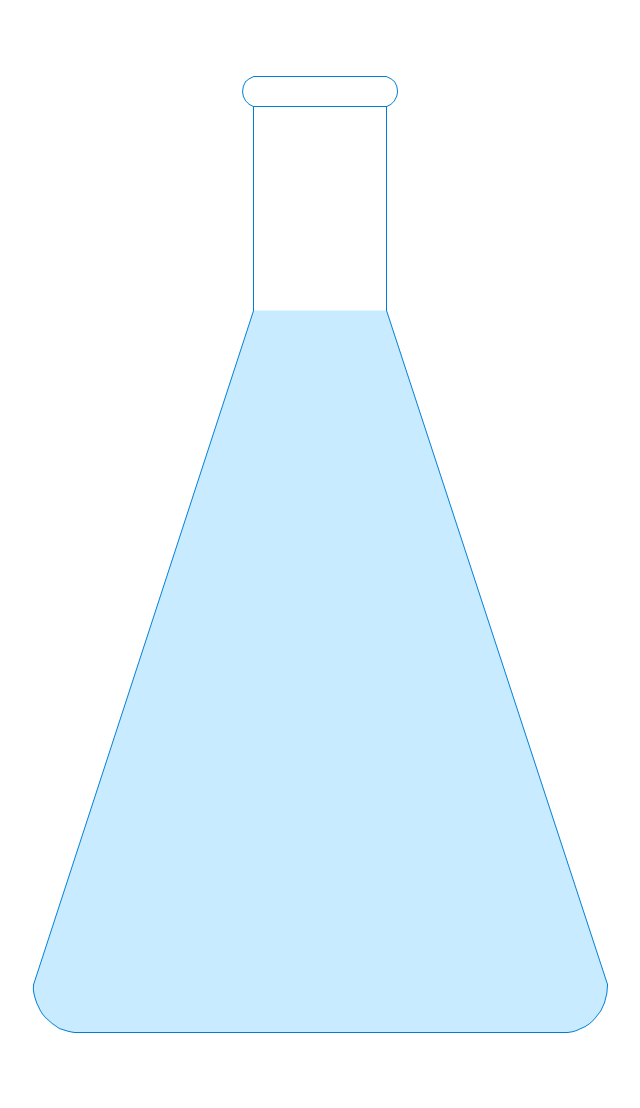
The vector stencils library "Laboratory equipment" contains 31 clipart icons of chemical laboratory equipment and labware.
Use these shapes for drawing part assembly and mounting schemes of glassware apparatus in chemical experiment diagrams and illustrations in the ConceptDraw PRO diagramming and vector drawing software extended with the Chemistry solution from the Science and Education area of ConceptDraw Solution Park.
Use these shapes for drawing part assembly and mounting schemes of glassware apparatus in chemical experiment diagrams and illustrations in the ConceptDraw PRO diagramming and vector drawing software extended with the Chemistry solution from the Science and Education area of ConceptDraw Solution Park.
Vigreux distillation column
Hirsch funnel
Oil bath

Steam bath
Thermometer
Tap (valve)
--laboratory-equipment---vector-stencils-library.png--diagram-flowchart-example.png)
Vacuum adaptor
Liebig condenser (long)
-laboratory-equipment---vector-stencils-library.png--diagram-flowchart-example.png)
Liebig condenser (short)
-laboratory-equipment---vector-stencils-library.png--diagram-flowchart-example.png)
Water faucet
Büchner flask

Stemless funnel
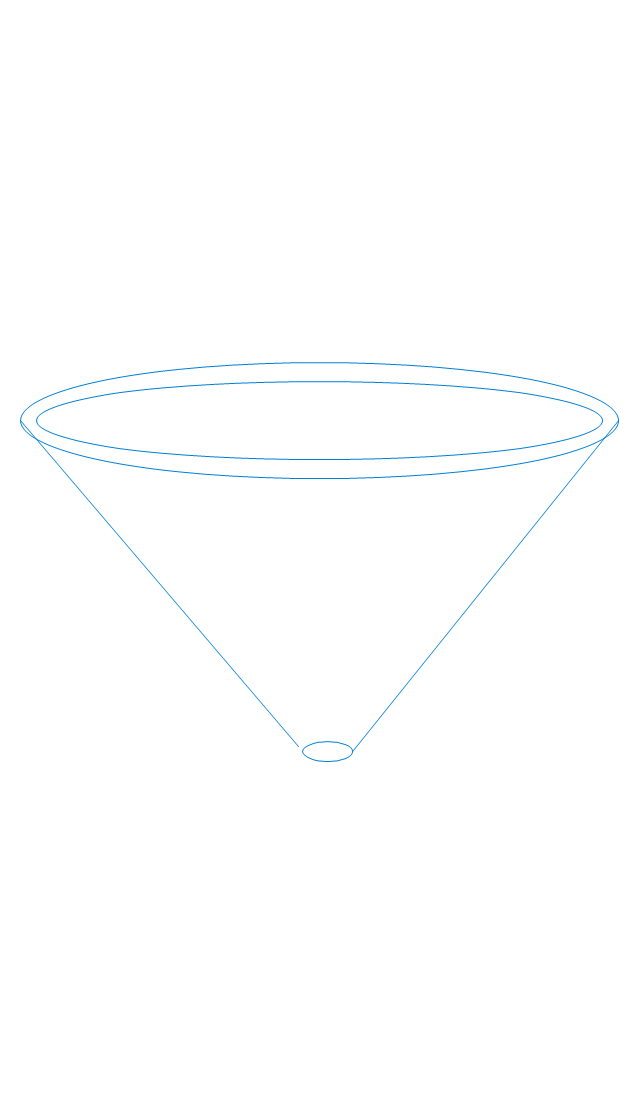
Stemmed funnel

Separatory funnel

Heating mantle

Hot plate

Gas tap
Folded filter paper

Y-Adaptor
Claisen adapter

Bunsen burner
Büchner funnel

Erlenmeyer flask, 25ml

Round-bottom flask, 50ml

Round-bottom flask, 250ml

Beaker 100ml, filled
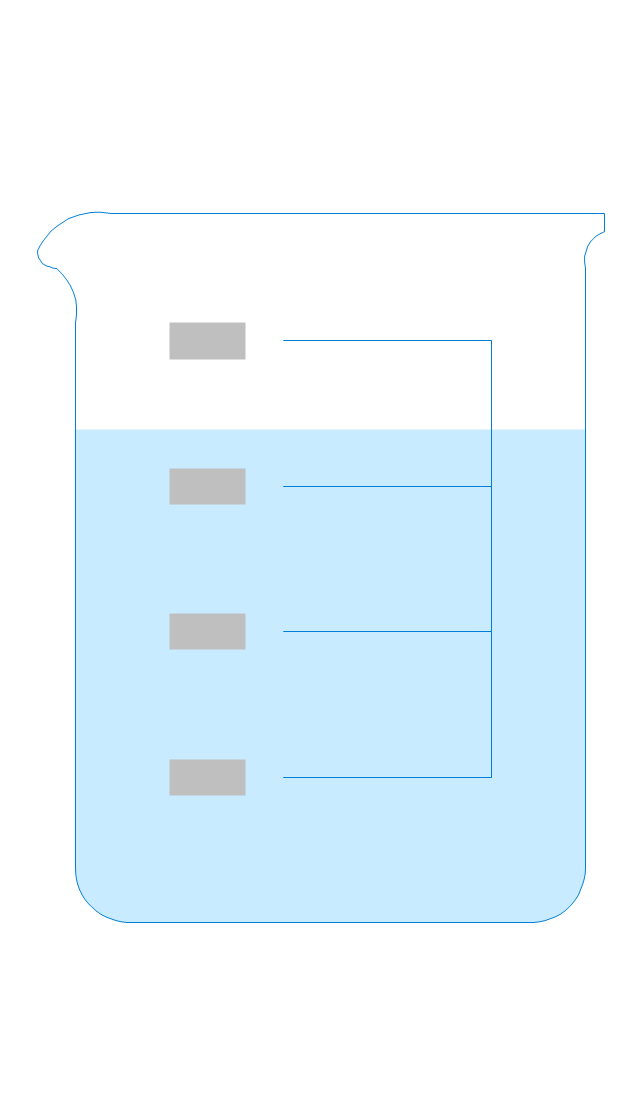
Beaker 100ml, empty

Beaker 500ml, filled
Beaker 500ml, empty

Erlenmeyer flask 250ml, filled
Erlenmeyer flask 250ml, empty
Entity Relationship Diagram Symbols

Cisco Icons

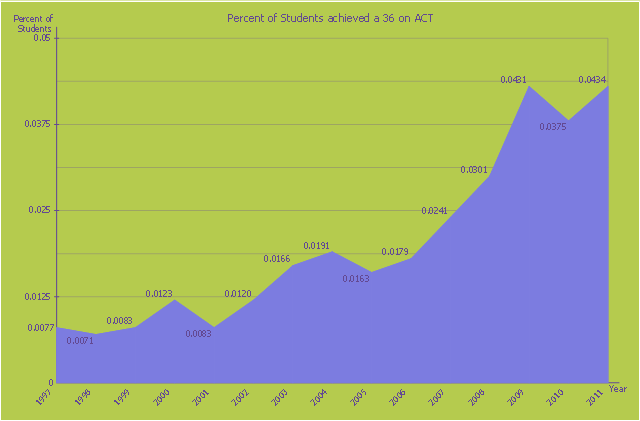
This area chart sample shows the percent of students achieved a 36 on ACT from 1997 to 2011. It was designed on the base of the Wikimedia Commons file: ACT-36-1997 to 2011.png. [commons.wikimedia.org/ wiki/ File:ACT-36-1997_ to_ 2011.png]
This file is licensed under the Creative Commons Attribution-Share Alike 3.0 Unported license. [creativecommons.org/ licenses/ by-sa/ 3.0/ deed.en]
"The ACT (originally an abbreviation of American College Testing) college readiness assessment is a standardized test for high school achievement and college admissions in the United States produced by ACT, Inc. ...
The required portion of the ACT is divided into four multiple choice subject tests: English, mathematics, reading, and science reasoning. Subject test scores range from 1 to 36; all scores are integers. The English, mathematics, and reading tests also have subscores ranging from 1 to 18. (The subject score is not the sum of the subscores.) The composite score is the average of all four tests. In addition, students taking the optional writing test receive a writing score ranging from 1 to 36 (This is a change from the previous 2–12 score range). The writing score does not affect the composite score." [ACT (test). Wikipedia]
The area graph example "Persent of Students achieved a 36 on ACT" was created using the ConceptDraw PRO diagramming and vector drawing software extended with the Area Charts solution from the Graphs and Charts area of ConceptDraw Solution Park.
Area chart
- School layout - Vector stencils library | Desk Aerial View Png Drawing
- School layout - Vector stencils library | Interior Design School Layout ...
- Professions - Vector stencils library | Bar Graphs | Walking Student ...
- Air Hostess Student Png
- Picto Png Student
- Percent of students achieved a 36 on ACT | Percent of Students ...
- School layout - Vector stencils library | Building Drawing . Design ...
- Vector Png Images
- HR symbols - Vector stencils library | Company's organizational ...
- School layout - Vector stencils library | Network Glossary Definition ...