 Stakeholder Onion Diagrams
The Stakeholder Onion Diagram is often used as a way to view the relationships of stakeholders to a project goal. A basic Onion Diagram contains a rich information. It shows significance of stakeholders that will have has influence to the success achieve
 PM Dashboards
This solution extends ConceptDraw PRO and ConceptDraw PROJECT software with the ability to clearly display the identified key performance indicators for any project.
HelpDesk
How to Create a Stakeholder Onion Diagram Using ConceptDraw PRO

 ConceptDraw Dashboard for Facebook
ConceptDraw Dashboard for Facebook solution extends ConceptDraw PRO software with a dynamically updated visual dashboard, which shows lifetime total likes, daily friends of fans, and daily page views, information you can receive from Facebook Insights.
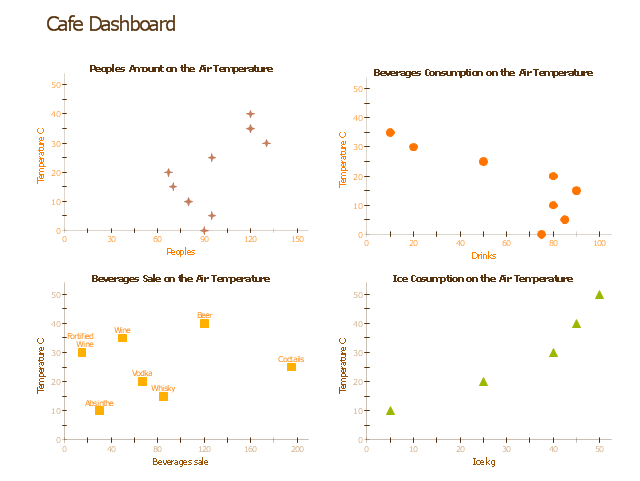
"A performance metric is that which determines an organization's behavior and performance. Performance metrics measure of an organization's activities and performance. It should support a range of stakeholder needs from customers, shareholders to employees. While traditionally many metrics are finance based, inwardly focusing on the performance of the organization, metrics may also focus on the performance against customer requirements and value. In project management, performance metrics are used to assess the health of the project and consist of the measuring of seven criteria: safety, time, cost, resources, scope, quality, and actions. Developing performance metrics usually follows a process of: 1. Establishing critical processes/ customer requirements. 2. Identifying specific, quantifiable outputs of work. 3. Establishing targets against which results can be scored." [Performance metric. Wikipedia] The example "Cafe performance metrics vs. air temperature - Visual dashboard" was created using the ConceptDraw PRO diagramming and vector drawing software extended with the Corellation Dashboard solution from the area "What is a Dashboard" of ConceptDraw Solution Park.
Visual dashboard
 ConceptDraw Solution Park
ConceptDraw Solution Park collects graphic extensions, examples and learning materials
 Sales Dashboard
Sales Dashboard solution extends ConceptDraw PRO software with templates, samples and library of vector stencils for drawing the visual dashboards of sale metrics and key performance indicators (KPI).
 Spatial Dashboard
Spatial dashboard solution extends ConceptDraw PRO software with templates, samples and vector stencils libraries with thematic maps for drawing visual dashboards showing spatial data.
 Business Intelligence Dashboard
Business Intelligence Dashboard solution extends the ConceptDraw PRO v11 functionality with exclusive tools, numerous ready-to-use vector objects, samples and quick-start templates for creation professional Business Intelligence Dashboards, Business Intelligence Graphics, Business Intelligence Charts and Maps of different kinds. Design easy the BI dashboard, BI model or Dynamic chart in ConceptDraw PRO to monitor the company's work, to track the indicators corresponding your company's data, to display and analyze key performance indicators, to evaluate the trends and regularities of the processes occurring at the company.
 Meter Dashboard
Meter dashboard solution extends ConceptDraw PRO software with templates, samples and vector stencils library with meter indicators for drawing visual dashboards showing quantitative data.
 Frequency Distribution Dashboard
Frequency distribution dashboard solution extends ConceptDraw PRO software with samples, templates and vector stencils libraries with histograms and area charts for drawing the visual dashboards showing frequency distribution of data.
 Comparison Dashboard
Comparison dashboard solution extends ConceptDraw PRO software with samples, templates and vector stencils library with charts and indicators for drawing the visual dashboard comparing data.
How To Create Onion Diagram

 Status Dashboard
Status dashboard solution extends ConceptDraw PRO software with templates, samples and vector stencils libraries with graphic indicators for drawing the visual dashboards showing status data.
 Correlation Dashboard
Correlation dashboard solution extends ConceptDraw PRO software with samples, templates and vector stencils library with Scatter Plot Charts for drawing the visual dashboard visualizing data correlation.
- Sales Dashboard | Aerospace and Transport | Stakeholder Onion ...
- Status Dashboard | Area Charts | Stakeholder Onion Diagrams ...
- Area Charts | Status Dashboard | Stakeholder Onion Diagrams ...
- Cafe performance metrics vs. air temperature - Visual dashboard ...
- Sales Dashboard | PM Dashboards | Meter Dashboard | Health And ...
- Customer Relationship Management | Dashboard | Balanced ...
- Stakeholder Onion Diagrams | Office Layout Plans | Comparison ...
- Competitor Analysis | Geo Map - USA - Illinois | Stakeholder ...
- Clipart Project Manager Stakeholders
- ConceptDraw Dashboard for Facebook | IDEF9 Standard | Venn ...
- Geo Map - United States of America Map | Continent Maps | Sales ...
- What are Infographic Area | Sales Dashboard | Www Timelines ...
- Enterprise dashboard | Business Intelligence Dashboard | Design ...
- How to Create and Customize a Calendar in ConceptDraw PRO ...
- Dashboard | Strategy Map | Sales Dashboard | Metrics Dashboard ...
- Sales metrics and KPIs - Visual dashboard | What is a KPI ...
- Pyramid Diagram | Stakeholder Onion Diagrams | 4 Layers Of The ...
- Sales Dashboards for Your Company | How to Create a Bar Chart in ...
- How to Create a Bar Chart in ConceptDraw PRO | PM Dashboards ...
- Sales Dashboard | How to Add a Telecommunication Network ...