 Computer Network Diagrams
Computer Network Diagrams solution extends ConceptDraw PRO software with samples, templates and libraries of vector icons and objects of computer network devices and network components to help you create professional-looking Computer Network Diagrams, to plan simple home networks and complex computer network configurations for large buildings, to represent their schemes in a comprehensible graphical view, to document computer networks configurations, to depict the interactions between network's components, the used protocols and topologies, to represent physical and logical network structures, to compare visually different topologies and to depict their combinations, to represent in details the network structure with help of schemes, to study and analyze the network configurations, to communicate effectively to engineers, stakeholders and end-users, to track network working and troubleshoot, if necessary.
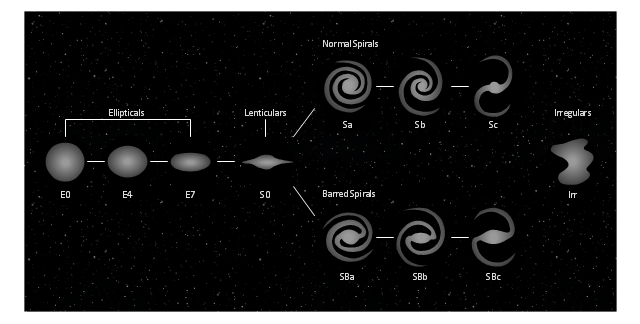
This tuning-fork style diagram of the Hubble sequence was created on the base of the Wikimedia Commons file: Hubble sequence photo.png. [commons.wikimedia.org/ wiki/ File:Hubble_ sequence_ photo.png]
"The Hubble sequence is a morphological classification scheme for galaxies invented by Edwin Hubble in 1936. It is often known colloquially as the Hubble tuning fork diagram because of the shape in which it is traditionally represented.
Hubble’s scheme divides regular galaxies into 3 broad classes - ellipticals, lenticulars and spirals - based on their visual appearance (originally on photographic plates). A fourth class contains galaxies with an irregular appearance. To this day, the Hubble sequence is the most commonly used system for classifying galaxies, both in professional astronomical research and in amateur astronomy." [Hubble sequence. Wikipedia]
The astronomical diagram example "Tuning-fork style diagram of the Hubble sequence" was created using the ConceptDraw PRO diagramming and vector drawing software extended with the Astronomy solution from the Science and Education area of ConceptDraw Solution Park.
Morphological classification scheme for galaxies
The vector stencils library "Fault tree analysis diagrams" contains 12 symbols for drawing Fault Tree Analysis (FTA) diagrams.
"Fault tree analysis (FTA) is a top down, deductive failure analysis in which an undesired state of a system is analyzed using Boolean logic to combine a series of lower-level events. This analysis method is mainly used in the fields of safety engineering and reliability engineering to understand how systems can fail, to identify the best ways to reduce risk or to determine (or get a feeling for) event rates of a safety accident or a particular system level (functional) failure. FTA is used in the aerospace, nuclear power, chemical and process, pharmaceutical, petrochemical and other high-hazard industries; but is also used in fields as diverse as risk factor identification relating to social service system failure.
In aerospace, the more general term "system Failure Condition" is used for the "undesired state" / Top event of the fault tree. These conditions are classified by the severity of their effects. The most severe conditions require the most extensive fault tree analysis. These "system Failure Conditions" and their classification are often previously determined in the functional Hazard analysis." [Fault tree analysis. Wikipedia]
The shapes example "Fault tree analysis diagrams" was created using the ConceptDraw PRO diagramming and vector drawing software extended with the Fault Tree Analysis Diagrams solution from the Engineering area of ConceptDraw Solution Park.
FTA diagram symbols

The vector stencils library "Logical network diagram" contains 16 symbols for drawing logical computer network diagrams.
"The logical topology ... is the way that the signals act on the network media, or the way that the data passes through the network from one device to the next without regard to the physical interconnection of the devices. A network's logical topology is not necessarily the same as its physical topology. ...
The logical classification of network topologies generally follows the same classifications as those in the physical classifications of network topologies but describes the path that the data takes between nodes being used as opposed to the actual physical connections between nodes. The logical topologies are generally determined by network protocols as opposed to being determined by the physical layout of cables, wires, and network devices or by the flow of the electrical signals, although in many cases the paths that the electrical signals take between nodes may closely match the logical flow of data, hence the convention of using the terms logical topology and signal topology interchangeably.
Logical topologies are often closely associated with Media Access Control methods and protocols. Logical topologies are able to be dynamically reconfigured by special types of equipment such as routers and switches." [Network topology. Wikipedia]
The symbols example "Logical network diagram - Vector stencils library" was created using the ConceptDraw PRO diagramming and vector drawing software extended with the Computer and Networks solution from the Computer and Networks area of ConceptDraw Solution Park.
www.conceptdraw.com/ solution-park/ computer-and-networks
Server
Disk
Printer
Domain

Network

File

Group

Root
Shared Admin

Directory

Tree
NDS Container

Unknown

Neightborhood

Service

Information
IDEF9 Standard

A four level pyramid model of different types of Information Systems based on the different levels of hierarchy in an organization. The first level represents transaction processing systems for workers. The second level represents management information systems for middle managers. The third level represents decision support systems for senior menegers. The fourth level represents executive information systems for executives.
"The "classic" view of Information systems found in the textbooks in the 1980s was of a pyramid of systems that reflected the hierarchy of the organization, usually transaction processing systems at the bottom of the pyramid, followed by management information systems, decision support systems, and ending with executive information systems at the top. Although the pyramid model remains useful, since it was first formulated a number of new technologies have been developed and new categories of information systems have emerged, some of which no longer fit easily into the original pyramid model.
Some examples of such systems are:
data warehouses,
enterprise resource planning,
enterprise systems,
expert systems,
search engines,
geographic information system,
global information system,
office automation." [Information systems. Wikipedia]
This diagram was redesigned using the ConceptDraw PRO diagramming and vector drawing software from Wikimedia Commons file Four-Level-Pyramid-model.png. [commons.wikimedia.org/ wiki/ File:Four-Level-Pyramid-model.png]
This file is licensed under the Creative Commons Attribution-Share Alike 3.0 Unported license. [creativecommons.org/ licenses/ by-sa/ 3.0/ deed.en]
The triangle chart example "Information systems types" is included in the Pyramid Diagrams solution from the Marketing area of ConceptDraw Solution Park.
Pyramid diagram

- Show The Classification Of Software With Help Of Chart
- Classification Of Software With The Help Of Charts
- UML Class Diagram Generalization Example UML Diagrams | Types ...
- Draw The Classification Chart Of Computer
- Draw The Classification Chart Of Computers
- Classification Of Resources Make Chart
- Classification Of Resources Flow Chart
- Tree Diagram For Computer Classification
- Computer Network Diagrams | Metropolitan area networks (MAN ...
- 4 Level pyramid model diagram - Information systems types | 5 Level ...
- Flow Chart Of Classification Of Natural Resources
- Computer Network Diagrams | Metropolitan area networks (MAN ...
- Classification Of Resource Make The Chart
- Flow Chart Of Classification Of Resources
- Pyramid Diagram Classification
- Design elements - Fault tree analysis diagrams | Types of Welding in ...
- Draw The Diagram Of All Kind Of Resources Classification
- Computer Network Diagrams | Metropolitan area networks (MAN ...
- Draw A Flow Chart To Show How Are Resources Are Classified
- Marketing Classification Flow Chart