"Offensive tactics in set pieces. ...
Throw-ins[edit]
How throw-ins are best handled depends on where it is:
(1) In one's own half the aim of a throw-in may be to retain possession in order to build up the next attack. The throw may or may not go toward the opponents' goal; the most unmarked player may be a full-back who is behind the ball. Such a throw followed by a quickly taken 'switch' pass can be an effective tactic. Under pressure however, the ball is often thrown up the line, toward the opponents' goal line to gain as much ground as possible.
(2) If the thrower is unmarked, a simple tactic is to take a short throw to the feet or chest of a marked player who immediately returns the ball to the thrower.
(3) In the last third of the pitch a player with a long throw can put pressure onto the defenders by throwing the ball deep into the opponents' penalty area, resulting in somewhat similar tactics to a corner kick situation, but with the added advantage of avoiding the offside trap, as an attacking player cannot be offside from a throw in. ...
Goal kicks.
A goal kick is an important 'set piece' that will occur many times in a game and yet few teams practice it. If taken quickly the kick may be taken short to a full-back who has run into a wide position. Although this may gain little ground it retains the all-important possession of the ball. A longer kick to the midfield is more common and it is vital that the midfield unit are in a position to receive it.
Corners.
A corner kick (or "corner") is a real goal scoring opportunity and it is essential to know who is the best at taking a good corner from both the left and right side of the pitch. A good corner will be aimed high across the goal and may be 'bent' towards or away from the goal. At least one of the forwards should be on or close to the goal line when the kick is taken.
Another tactic on a corner is to let the best shooter stay in the back "trash" position and have the defence worried about those up front. The player taking the corner kick makes a small pass back to the trash shooter who has time and space to take a good shot." [Association football tactics and skills. Wikipedia]
The diagram example "Association football (soccer) - The pitch: throw-ins, goal kicks, corners" was created using the ConceptDraw PRO diagramming and vector drawing software extended with the Football solution from the Sport area of ConceptDraw Solution Park.
www.conceptdraw.com/ solution-park/ sport-soccer
 Histograms
How to make a Histogram? Making a Histogram is an incredibly easy process when it is done with ConceptDraw PRO. The Histograms Solution enhances ConceptDraw PRO v10 functionality with extensive drawing tools, numerous samples, and examples; also a quick-start template and library of ready vector stencils for visualization the data and professional drawing Histograms.
 Basic Floor Plans
Detailed floor plan is the basis of any building project, whether a home, office, business center, restaurant, shop store, or any other building or premise. Basic Floor Plans solution is a perfect tool to visualize your creative projects, architectural and floor plans ideas.
HelpDesk
How to Customize a Task’s Duration
When you create an automatically scheduled task, ConceptDraw PROJECT assigns it duration of one day by default. You need modify that duration to reflect the real amount of time that the task requires.HelpDesk
How to Use Critical Path Analysis for Scheduling Complex Projects
Instruction on how to use this important project management tool with ConceptDraw PROJECTHelpDesk
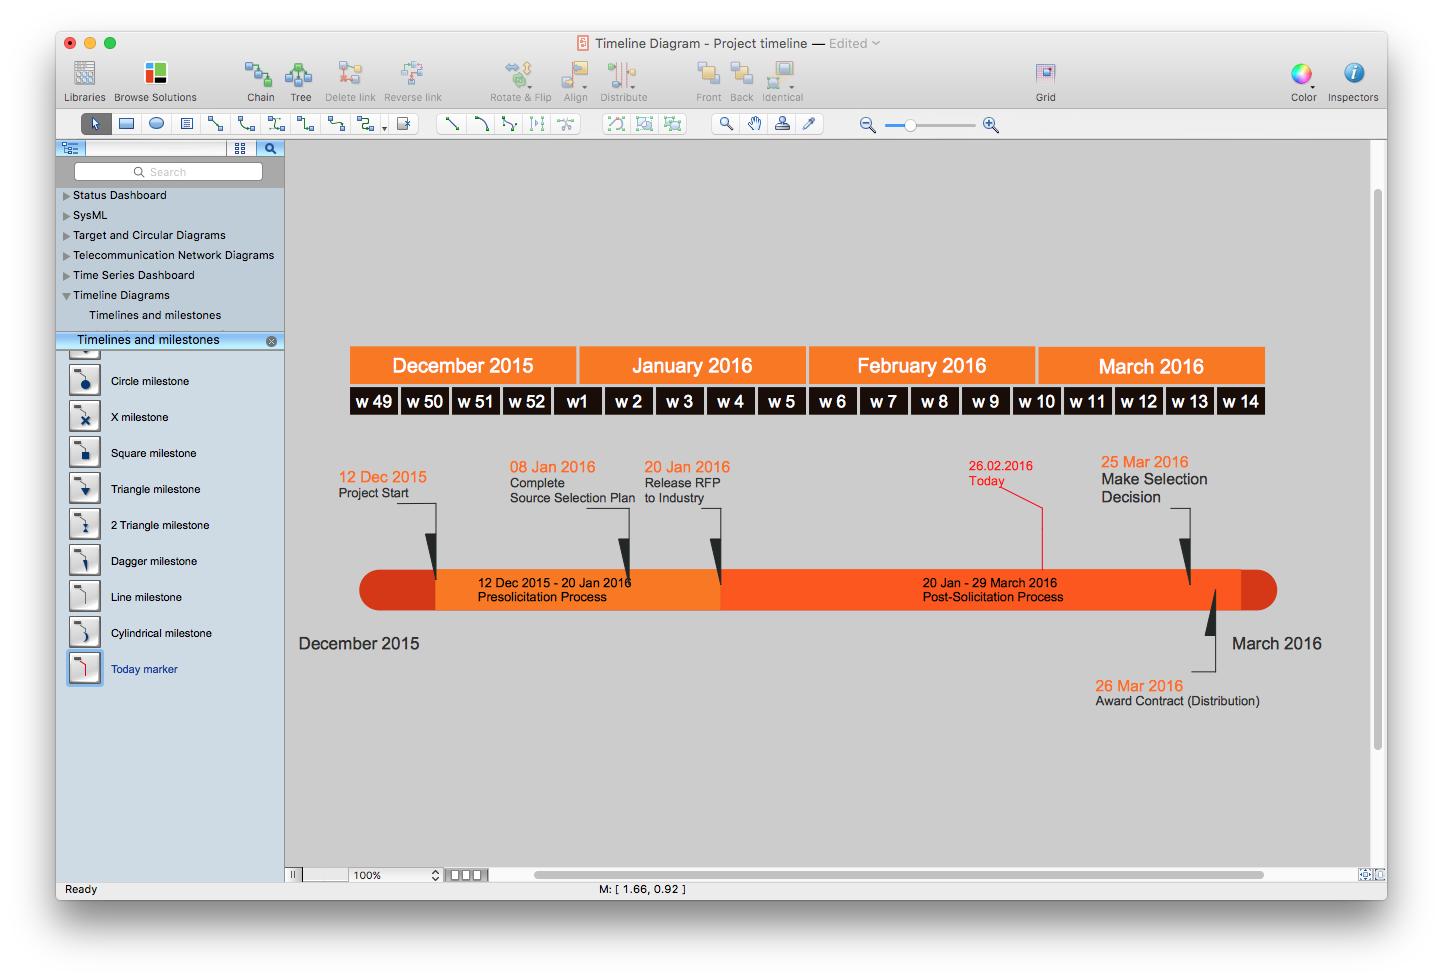
How to Create a Timeline Diagram in ConceptDraw PRO
A Timeline is a chart which displays a project plan schedule in chronological order. A Timeline is used in project management to depict project milestones and visualize project phases, and show project progress. The graphic form of a timeline makes it easy to understand critical project milestones, such as the progress of a project schedule. Timelines are particularly useful for project scheduling or project management when accompanied with a Gantt chart. It captures the main of what the project will accomplish and how it will be done. making a project timeline is one of the most important skills a project manager needs have. Making comprehensive, accurate timelines allows you getting every project off in the best way. ConceptDraw PRO allows you to draw a timeline charts using special library.HelpDesk
How to Draw a Block Diagram in ConceptDraw PRO
Block diagram is a simple chart that use blocks to show some elements or activities, and connectors that show the relationship between neighboring blocks. They are commonly simple, giving an overview of a process without necessarily going into the specifics of implementation. Block diagrams are commonly used to depict a general description of a system and its activity. A most known sample of a block diagram is a flow chart, used in many types of business as a common method of representing repeated processes. Easy and a simple creation, a number of objects and connectors make the block diagram a many-sided tool for various industries. The ability to make block diagrams is delivered by the ConceptDraw Block Diagrams solution.HelpDesk
What Information to be Displayed in the ConceptDraw PROJECT Gantt Chart View
What information can can contain the project task list? Gantt Chart view is a graphical representation of a project outline that allows one to allocate tasks.You can customize a project’s tasks list view to include the columns you need to meet your information requirements. The columns of the ConceptDraw PROJECT Gantt view contain the information you want to capture about each task in your project. The following article details what information can be contained in the columns of a project outline:<
- Soccer ( Football ) Tactics | Soccer ( Football ) Formation | Association ...
- Soccer ( Football ) Dimensions | Sport Field Plans | Basketball Court ...
- Soccer ( Football ) Dimensions | Soccer ( Football ) Field Templates ...
- Soccer ( Football ) Field Templates | Soccer ( Football ) Formation ...
- Association football ( soccer ) field dimensions | Soccer ( Football ...
- Soccer ( Football ) Formation | Playground Layout | Sport Field Plans ...
- Soccer ( Football ) Positions | Soccer ( Football ) Tactics | Association ...
- Association football ( soccer ) - The pitch: throw-ins, goal kicks, corners
- Basketball Court Diagram and Basketball Positions | Soccer ...
- Soccer ( Football ) Positions | Soccer ( Football ) Formation | Soccer ...
- Soccer ( Football ) Tactics | Association football ( soccer ) - The pitch ...
- Football pitch metric | Association football ( soccer ) - The pitch: throw ...
- Soccer ( Football ) Dimensions | Association football ( soccer ) - The ...
- Soccer ( Football ) Positions | Soccer ( Football ) Tactics | Association ...
- Design elements - Soccer ( Football ) positions | How to Make Soccer ...
- Create Soccer ( Football ) Positions | Soccer ( Football ) Dimensions ...
- Soccer ( Football ) Positions | American football positions - Vector ...
- Soccer ( Football ) Positions | Soccer ( Football ) Field Templates ...
- Soccer ( Football ) Field Templates | Association football ( soccer ...
- Soccer ( Football ) Formation | Soccer ( Football ) Positions | Soccer ...
-tactics-diagram-association-football-(soccer)---the-pitch:-throw-ins,-goal-kicks,-corners.png--diagram-flowchart-example.png)


