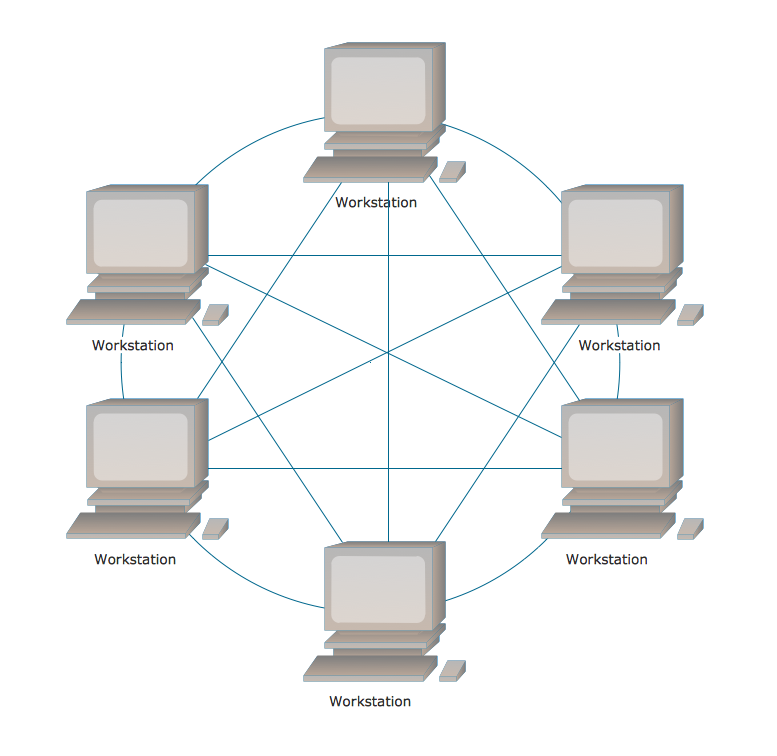
Network diagram is effective tool for representing and description the network knots and connections between them in comprehensible graphic view, for studying and analysis them. The network administrators and engineers actively use Physical Network Diagrams and Logical Network Diagrams, which are both indispensable when developing and documenting new networks, and managing existing ones. Network diagrams let clearly represent the network configuration and structure, used protocols, addresses, and also names of network objects. Physical Network Diagrams depict the information about telecommunications data, servers, location of network equipment and number of network users. Logical Network Diagrams describe about logical network structure.
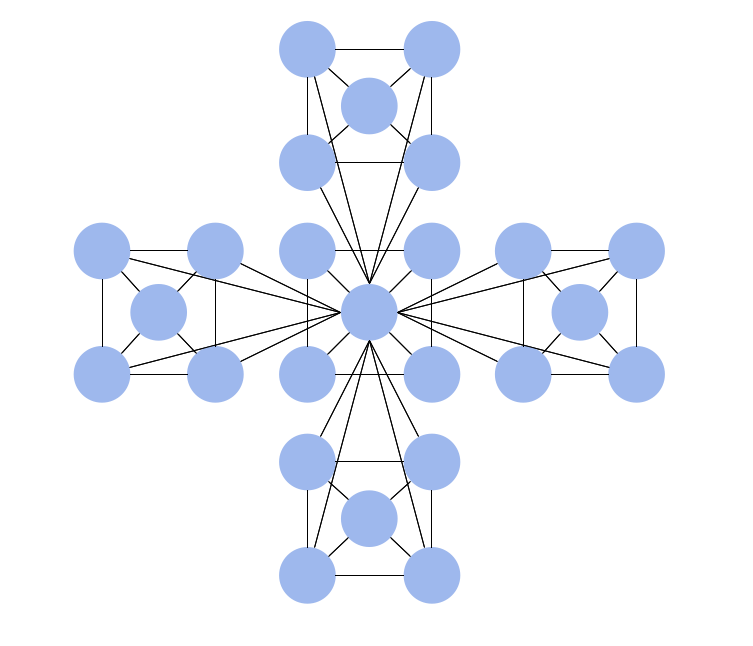
It is useful to use the ready sets of network clipart, pictures and symbols for indication the network knots on a diagram, such as developed by professionals and offered in large quantity by Computer Network Diagrams solution from ConceptDraw Solution Park.