Diagramming software for Amazon Web Service icon set: Monitoring, Deployment, Management
This Azure cloud architecture pattern diagram template was created on the base of figure in the article "Health Endpoint Monitoring Pattern" from the Microsoft Developer Network (MSDN) website.
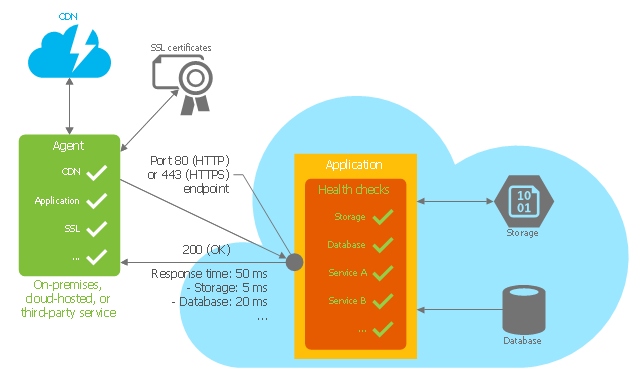
"Health Endpoint Monitoring Pattern.
Implement functional checks within an application that external tools can access through exposed endpoints at regular intervals. This pattern can help to verify that applications and services are performing correctly. ...
It is good practice—and often a business requirement—to monitor web applications, and middle-tier and shared services, to ensure that they are available and performing correctly. However, it is more difficult to monitor services running in the cloud than it is to monitor on-premises services. ...
Implement health monitoring by sending requests to an endpoint on the application. The application should perform the necessary checks, and return an indication of its status.
A health monitoring check typically combines two factors: the checks (if any) performed by the application or service in response to the request to the health verification endpoint, and analysis of the result by the tool or framework that is performing the health verification check. The response code indicates the status of the application and, optionally, any components or services it uses. The latency or response time check is performed by the monitoring tool or framework." [msdn.microsoft.com/ ru-RU/ library/ dn589789.aspx]
The Azure cloud system architecture diagram template "Health endpoint monitoring pattern" for the ConceptDraw PRO diagramming and vector drawing software is included in the Azure Architecture solutin from the Computer and Networks area of ConceptDraw Solution Park.
Cloud computing system architecture diagram template
AWS icons 2.0

Diagramming Software for Design UML Use Case Diagrams


This step diagram example was redesigned from the Wikimedia Commons file: Cloud Testing steps.png. [commons.wikimedia.org/ wiki/ File:Cloud_ Testing_ steps.png]
This file is licensed under the Creative Commons Attribution-Share Alike 3.0 Unported license. [creativecommons.org/ licenses/ by-sa/ 3.0/ deed.en]
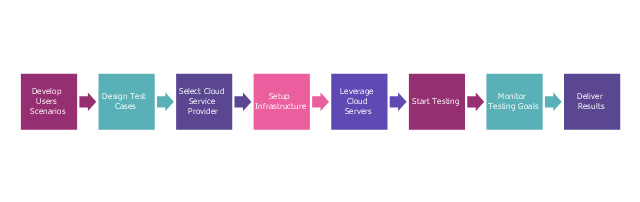
"Cloud testing is a form of software testing in which web applications use cloud computing environments (a "cloud") to simulate real-world user traffic. ...
Cloud Testing uses cloud infrastructure for software testing. Organizations pursuing testing in general and load, performance testing and production service monitoring in particular are challenged by several problems like limited test budget, meeting deadlines, high costs per test, large number of test cases, and little or no reuse of tests and geographical distribution of users add to the challenges. Moreover ensuring high quality service delivery and avoiding outages requires testing in one's datacenter, outside the data-center, or both. Cloud Testing is the solution to all these problems. Effective unlimited storage, quick availability of the infrastructure with scalability, flexibility and availability of distributed testing environment reduce the execution time of testing of large applications and lead to cost-effective solutions." [Cloud testing. Wikipedia]
The step chart example "Cloud testing steps" was created using the ConceptDraw PRO diagramming and vector drawing software extended with the Marketing Diagrams solution from the Marketing area of ConceptDraw Solution Park.
www.conceptdraw.com/ solution-park/ marketing-diagrams
This file is licensed under the Creative Commons Attribution-Share Alike 3.0 Unported license. [creativecommons.org/ licenses/ by-sa/ 3.0/ deed.en]
"Cloud testing is a form of software testing in which web applications use cloud computing environments (a "cloud") to simulate real-world user traffic. ...
Cloud Testing uses cloud infrastructure for software testing. Organizations pursuing testing in general and load, performance testing and production service monitoring in particular are challenged by several problems like limited test budget, meeting deadlines, high costs per test, large number of test cases, and little or no reuse of tests and geographical distribution of users add to the challenges. Moreover ensuring high quality service delivery and avoiding outages requires testing in one's datacenter, outside the data-center, or both. Cloud Testing is the solution to all these problems. Effective unlimited storage, quick availability of the infrastructure with scalability, flexibility and availability of distributed testing environment reduce the execution time of testing of large applications and lead to cost-effective solutions." [Cloud testing. Wikipedia]
The step chart example "Cloud testing steps" was created using the ConceptDraw PRO diagramming and vector drawing software extended with the Marketing Diagrams solution from the Marketing area of ConceptDraw Solution Park.
www.conceptdraw.com/ solution-park/ marketing-diagrams
Step chart
Diagramming software for Amazon Web Service icon set: Networking and Content Delivery
AWS

Diagramming software for Amazon Web Service icon set: Storage
The vector stencils library "AWS Management Tools" contains 28 Amazon Web Services management tools icons.
Use it to draw AWS architecture diagrams with ConceptDraw PRO software.
Amazon Management Tools services includes: "Amazon CloudWatch (Monitor Resources and Applications), Amazon EC2 Systems Manager (Configure and Manage EC2 Instances and On-premises Servers), AWS CloudFormation (Create and Manage Resources with Templates), AWS CloudTrail (Track User Activity and API Usage), AWS Config (Track Resource Inventory and Changes), AWS OpsWorks (Automate Operations with Chef), AWS Service Catalog (Create and Use Standardized Products), AWS Trusted Advisor (Optimize Performance and Security), AWS Personal Health Dashboard (Personalized view of AWS service health)" [aws.amazon.com]
The AWS icons example "Design elements - AWS Management Tools" is included in the AWS Architecture Diagrams solution from the Computer and Networks area of ConceptDraw Solution Park.
Amazon Web Services icons

The vector stencils library "AWS Analytics" contains 21 icons: Amazon Athena icon, Amazon CloudSearch icons, Amazon EMR icons, Amazon ES icons, Amazon Kinesis icons, Amazon QuickSight icon, Amazon Redshift icons, AWS Data Pipeline icon.
Use it to draw Amazon Web Services architecture diagrams with ConceptDraw PRO diagramming and vector drawing software.
"Amazon Elasticsearch Service is a managed service that makes it easy to deploy, operate, and scale Elasticsearch in the AWS Cloud. Elasticsearch is a popular open-source search and analytics engine for use cases such as log analytics, real-time application monitoring, and click stream analytics." [aws.amazon.com/ elasticsearch-service/ ]
"Amazon Elastic MapReduce (Amazon EMR) is a web service that makes it easy to quickly and cost-effectively process vast amounts of data." [aws.amazon.com/ elasticmapreduce/ ]
"Amazon Kinesis is a platform for streaming data on AWS, offering powerful services to make it easy to load and analyze streaming data, and also providing the ability for you to build custom streaming data applications for specialized needs." [aws.amazon.com/ kinesis/ ]
"Amazon Machine Learning is a service that makes it easy for developers of all skill levels to use machine learning technology." [aws.amazon.com/ machine-learning/ ]
"Amazon QuickSight is a very fast, cloud-powered business intelligence (BI) service that makes it easy for all employees to build visualizations, perform ad-hoc analysis, and quickly get business insights from their data." [aws.amazon.com/ quicksight/ ]
"AWS Data Pipeline is a web service that helps you reliably process and move data between different AWS compute and storage services, as well as on-premise data sources, at specified intervals." [aws.amazon.com/ datapipeline/ ]
The AWS icons example "Design elements - AWS Analytics" is included in the AWS Architecture Diagrams solution from the Computer and Networks area of ConceptDraw Solution Park.
Amazon Web Services icons
How To Send Presentation via Skype (Mac OS X)


The FTA diagram sample "Fault tree analysis - Insulin delivery system" was redesigned from the illustration of "CMSI 641: Introduction to Software Engineering. Design of Critical Systems. B.J. Johnson. 2005. Loyola Marymount University".
"Another way of assessing hazards is using fault tree analysis. In this process, each of the identified hazards is covered by a detailed analysis to find out what might cause it. Either inductive or deductive reasoning is applied. In the case of software hazards, the usual focus is to determine faults that will cause the system to fail to deliver a system service, such as a monitoring system. A "fault tree" is constructed to link all the possible situations together, to help identify the interrelationships of the failures, which modules may cause them, and what "trickle-down effects" there might be. Here is an example of a fault tree, as applied to the Insulin delivery system from Sommerville...
Note that this tree is only partially complete, since only the potential software faults are shown on the diagram. The potential failures involving hardware, such as low battery, blood monitor or sensor failure, patient over-exertion or inattention, or medical staff failure are noticeable by their absence.
The fault tree and safety specification processes are two ways of helping with system risk assessment tasks. Once the risks are identified, there are other assessments that need to take place. First, the likelihood of the risk occurrance must be assessed. This is often quantifiable, so numbers may be assigned based on things like MTBF, latency effects, and other known entities. There may be other non-quantifiable contributors to the risk likelihood, however, such that these must be assessed and estimated by experts in the domain. (Don't short-change this process when dealing with critical systems!) Finally, the risk assessment must include the severity of the risk, meaning an estimation of the cost to the project in the event the risk item actually does occur. "Cost to the project" means all associated costs, including schedule delays, human injury, damage to hardware, corruption of data, and so on."
[myweb.lmu.edu/ bjohnson/ cmsi641web/ week15-2.html]
The FTA diagram example "Fault tree analysis - Insulin delivery system" was created using the ConceptDraw PRO diagramming and vector drawing software extended with the Fault Tree Analysis Diagrams solution from the Engineering area of ConceptDraw Solution Park.
FTA diagram

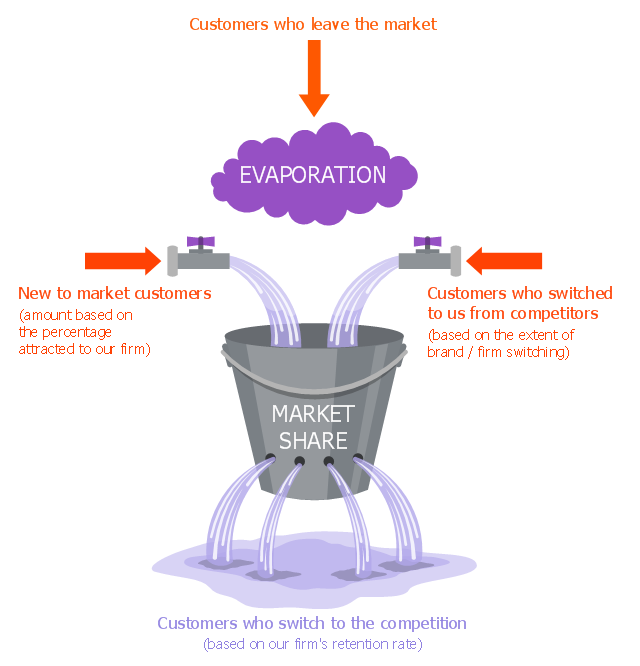
"The leaky bucket theory The leaky bucket theory is the model that seeks to describe the process of customer gain and loss, otherwise known as customer churn . Customer retention is one of the key concepts in relationship marketing. Most companies concentrate on recruiting new customers to replace customers who move on, rather than seeking to retain customers." [Blythe J. Key Concepts in Marketing. 2009. knowledge.sagepub.com/ view/ key-concepts-in-marketing/ n5.xml]
"Customer attrition, also known as customer churn, customer turnover, or customer defection, is the loss of clients or customers.
Banks, telephone service companies, Internet service providers, pay TV companies, insurance firms, and alarm monitoring services, often use customer attrition analysis and customer attrition rates as one of their key business metrics (along with cash flow, EBITDA, etc.) because the "...cost of retaining an existing customer is far less than acquiring a new one." Companies from these sectors often have customer service branches which attempt to win back defecting clients, because recovered long-term customers can be worth much more to a company than newly recruited clients." [Customer attrition. Wikipedia]
The example "Leaky bucket diagram" was created using the ConceptDraw PRO diagramming and vector drawing software extended with the Marketing Diagrams solution from the Marketing area of ConceptDraw Solution Park.
Leaky bucket diagram
Network Diagram Software ISG Network Diagram


- Field Service Monitoring Dashboard
- AWS icons 2.0 | Diagramming software for Amazon Web Service ...
- Diagramming software for Amazon Web Service icon set: Monitoring ...
- AWS Architecture Diagrams | Diagramming software for Amazon ...
- File Monitoring System Architecture
- Diagramming software for Amazon Web Service icon set ...
- Aws Trusted Advisor Monitoring
- Diagramming software for Amazon Web Service icon set
- Step chart - Cloud testing steps | Workitems workflow diagram | ER ...
- Diagramming tool - Amazon Web Services and Cloud Computing ...
- AWS Architecture Diagrams | Health endpoint monitoring pattern ...
- Bus Network Topology | Health endpoint monitoring pattern | Cisco ...
- Hvac Monitoring
- Health endpoint monitoring pattern | Cloud Computing Diagrams ...
- Health endpoint monitoring pattern | Windows Azure | Azure ...
- Workitems workflow diagram | Microsoft Azure StorSimple ...
- Diagramming software for Amazon Web Service diagrams, charts ...
- Workitems workflow diagram | Network Topologies | ER Diagram for ...
- Diagramming software for Amazon Web Service diagrams, charts ...
- Cloud Computing Architecture Diagrams | Competing consumers ...