The vector stencils library "School layout" contains 19 symbols of school furniture and educational equipment. Use these shapes for drawing layout floor plans of school classrooms, universiry lecture halls and auditories, training offices in he ConceptDraw PRO diagramming and vector drawing software extended with the School and Training Plans solution from the Building Plans area of ConceptDraw Solution Park.
Single Desk

Double Desk

Student Desk

Student Desk - Group of 2
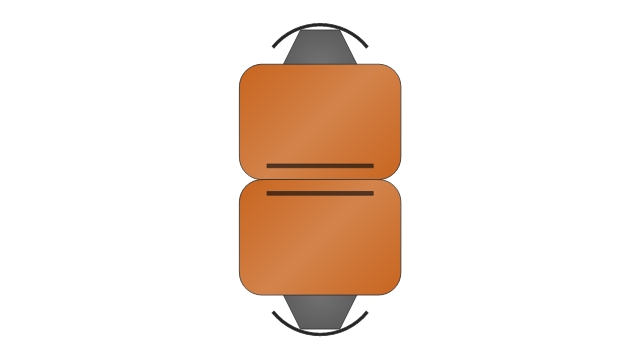
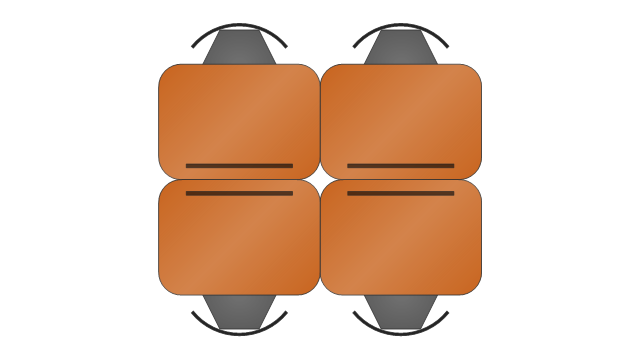
Student Desk - Group of 4
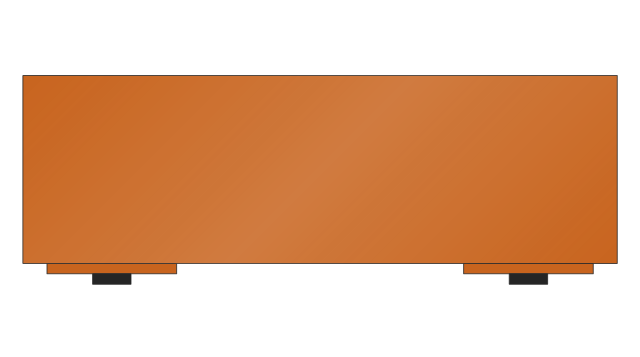
Lecture Hall Desk

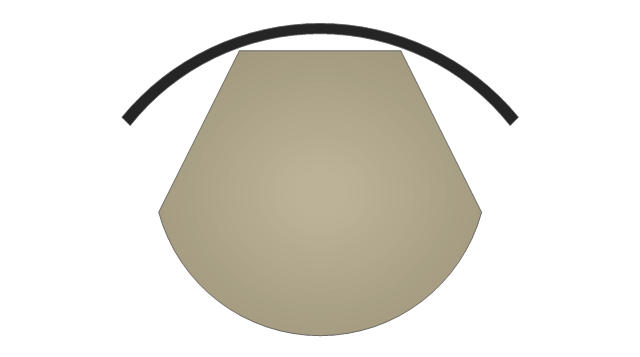
Chair

Curved Back Chair
Teacher's Desk
Bookcase

Podium
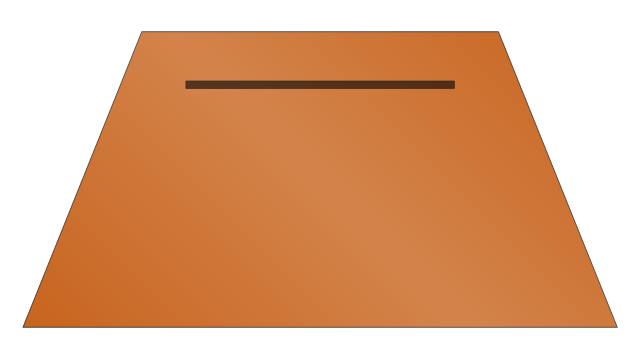
Semi-circular Table

Chalkboard
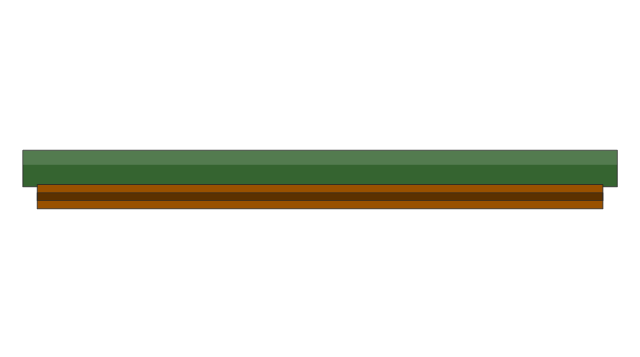
Portable Chalkboard

Screen
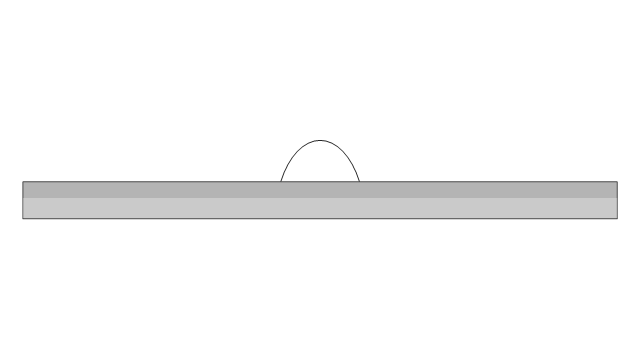
Locker
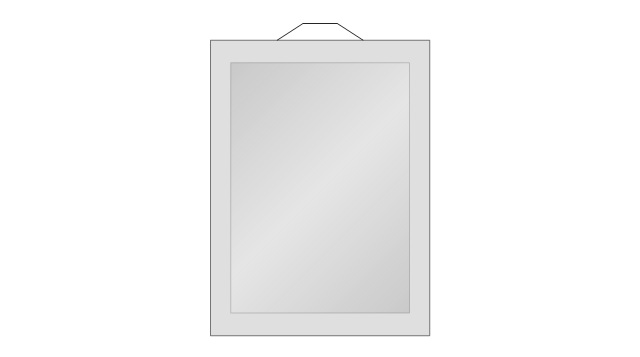
Bank of 5 Lockers
Globe

Papers

ERD Symbols and Meanings


The vector stencils library "School layout" contains 19 symbols of school furniture and educational equipment. Use these shapes for drawing layout floor plans of school classrooms, universiry lecture halls and auditories, training offices in he ConceptDraw PRO diagramming and vector drawing software extended with the School and Training Plans solution from the Building Plans area of ConceptDraw Solution Park.
Single Desk
Double Desk
Student Desk
Student Desk - Group of 2
Student Desk - Group of 4
Lecture Hall Desk
Chair
Curved Back Chair
Teacher's Desk
Bookcase
Podium
Semi-circular Table
Chalkboard
Portable Chalkboard
Screen
Locker
Bank of 5 Lockers
Globe
Papers
 Entity-Relationship Diagram (ERD)
An Entity-Relationship Diagram (ERD) is a visual presentation of entities and relationships. That type of diagrams is often used in the semi-structured or unstructured data in databases and information systems. At first glance ERD is similar to a flowch
 Floor Plans
Construction, repair and remodeling of the home, flat, office, or any other building or premise begins with the development of detailed building plan and floor plans. Correct and quick visualization of the building ideas is important for further construction of any building.
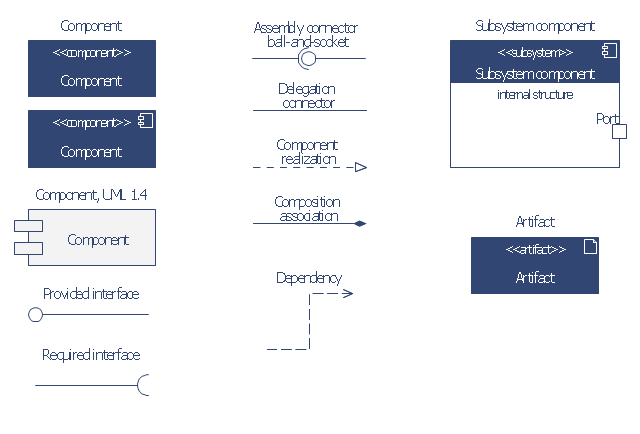
The vector stencils library "Bank UML component diagram" contains 13 shapes for drawing UML component diagrams.
Use it for object-oriented modeling of your bank information system.
"A component is something required to execute a stereotype function. Examples of stereotypes in components include executables, documents, database tables, files, and library files.
Components are wired together by using an assembly connector to connect the required interface of one component with the provided interface of another component. This illustrates the service consumer - service provider relationship between the two components. ...
When using a component diagram to show the internal structure of a component, the provided and required interfaces of the encompassing component can delegate to the corresponding interfaces of the contained components. ...
Symbols.
This may have a visual stereotype in the top right of the rectangle of a small rectangle with two even smaller rectangles jutting out on the left.
The lollipop, a small circle on a stick represents an implemented or provided interface. The socket symbol is a semicircle on a stick that can fit around the lollipop. This socket is a dependency or needed interface." [Component diagram. Wikipedia]
This example of UML component diagram symbols for the ConceptDraw PRO diagramming and vector drawing software is included in the ATM UML Diagrams solution from the Software Development area of ConceptDraw Solution Park.
UML component diagram symbols
Ice Hockey Diagram — Defensive Strategy — Neutral Zone Trap

, t chart, decision matrix, decision tree analysis") Decision Making
Decision Making
The Decision Making solution offers the set of professionally developed examples, powerful drawing tools and a wide range of libraries with specific ready-made vector decision icons, decision pictograms, decision flowchart elements, decision tree icons, decision signs arrows, and callouts, allowing the decision maker (even without drawing and design skills) to easily construct Decision diagrams, Business decision maps, Decision flowcharts, Decision trees, Decision matrix, T Chart, Influence diagrams, which are powerful in questions of decision making, holding decision tree analysis and Analytic Hierarchy Process (AHP), visual decomposition the decision problem into hierarchy of easily comprehensible sub-problems and solving them without any efforts.
Electrical Symbols — Semiconductor

- Design elements - Tables | Building Design Package | Semi Circle ...
- How To Draw A Semi Circular Floor Plan
- Designing Table Lamp In Semi Circle In Drawing
- Semi Circular Building Plans
- Floor Plan Of A Semi Circular Building
- Semi Circle Office Desk
- Semi Round Office Table
- Cafe and Restaurant Floor Plans | Design elements - Tables | Floor ...
- Semi Circular Floor Plans Of Office Building
- Semi Circular Plan For School Design