Basic Flowchart Symbols and Meaning
Flowcharts are the best for visually representation the business processes and the flow of a custom-order process through various departments within an organization. ConceptDraw PRO diagramming and vector drawing software extended with Flowcharts solution offers the full set of predesigned basic flowchart symbols which are gathered at two libraries: Flowchart and Flowcharts Rapid Draw. Among them are: process, terminator, decision, data, document, display, manual loop, and many other specific symbols. The meaning for each symbol offered by ConceptDraw gives the presentation about their proposed use in professional Flowcharts for business and technical processes, software algorithms, well-developed structures of web sites, Workflow diagrams, Process flow diagram and correlation in developing on-line instructional projects or business process system. Use of ready flow chart symbols in diagrams is incredibly useful - you need simply drag desired from the libraries to your document and arrange them in required order. There are a few serious alternatives to Visio for Mac, one of them is ConceptDraw PRO. It is one of the main contender with the most similar features and capabilities.
 ConceptDraw Solution Park
ConceptDraw Solution Park collects graphic extensions, examples and learning materials
HelpDesk
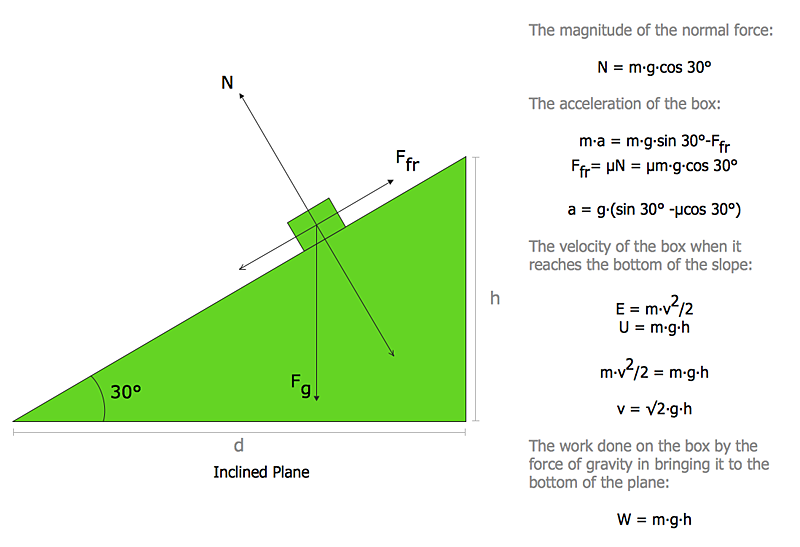
How to Draw Physics Diagrams in ConceptDraw PRO
Nothing is more helpful in the study of physics as a visual representation of the physical processes: physics schemes, diagrams and illustrations. Physics charts can be helpful when you learn Physics, perform experiments, or solve any other tasks regarding Physics. ConceptDraw PRO allows you to draw physical diagrams of mechanical, nuclear, optical and electrical processes using the set of vector physics symbols and physics diagram templates.HelpDesk
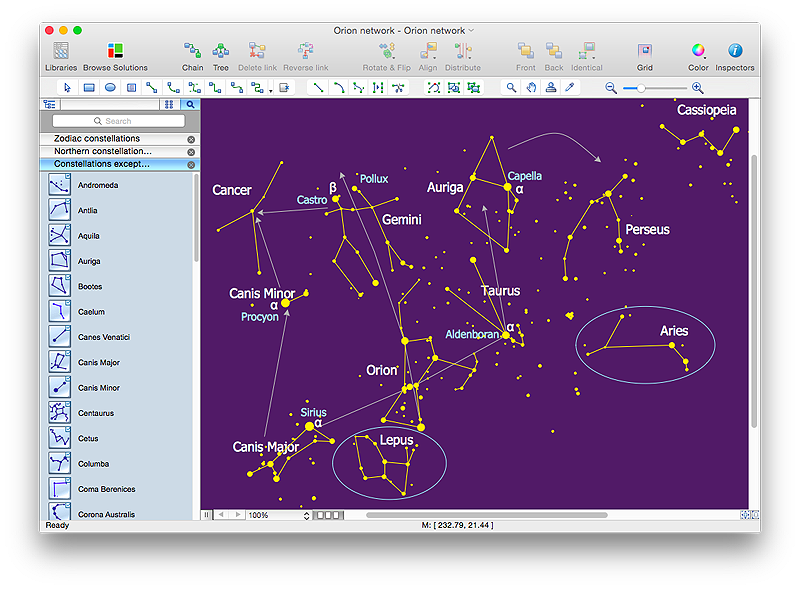
How to Draw a Сonstellation Сhart
Astronomic maps are used to locate stars, planets and other objects in the sky for a certain date, time and observing location. ConceptDraw Astronomy solution can be used as a tool for creating astronomy maps, charts and illustrations that contains astronomy symbols of constellations, galaxies, stars and planets. It allows you to draw the map of any constellation quickly and easily using the special templates and vector stencils libraries.
 Science and Education Area
The solutions from Science and Education Area of ConceptDraw Solution Park collect templates, samples and libraries of vector stencils for drawing the scientific and educational illustrations, diagrams and mind maps.
HelpDesk
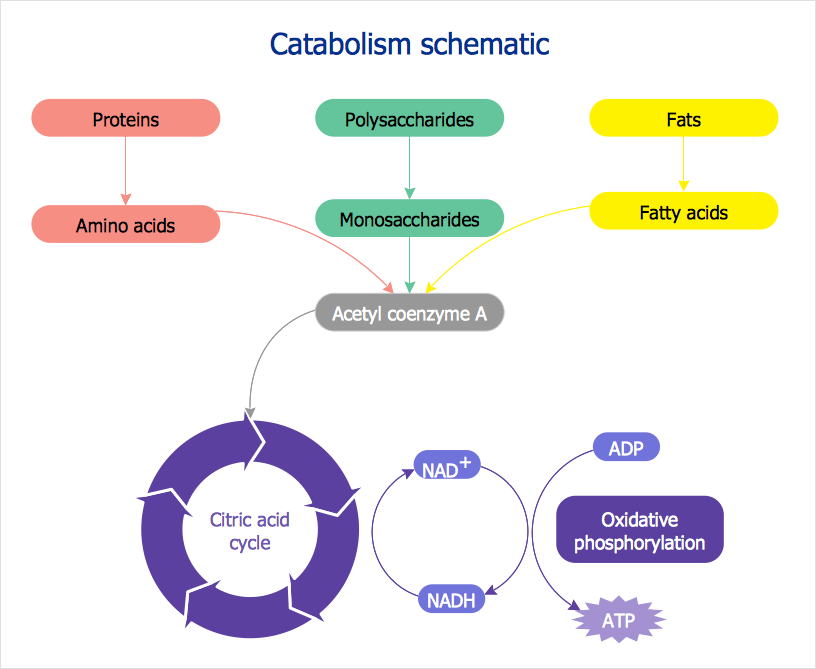
How to Draw Biology Diagram
Biology is the science studying the living forms of life. A good starting point when studying biology is to use drawings. Drawings help students to comprehend and remember knowledge that is difficult to explain and understand. Students are used to draw various specific diagrams such as the human circulatory systems or schemes of various biochemical processes. Researchers also need to complete their work with a variety of related diagrams and illustrations. ConceptDraw Biology solution allows you to draw various biological diagrams and schemes easily.
 Education Mind Maps
This solution extends ConceptDraw MINDMAP software with scientific and educational mind maps for educational documents, presentations, and websites.
Examples of Flowcharts, Org Charts and More
ConceptDraw PRO covers a broad spectrum of business graphics categories and offers at ConceptDraw STORE enormous online collection of pictorial examples and samples for different thematics and application areas. It is a plentiful source of inspiration and wonderful examples of professionally designed diagrams, flowcharts, UML diagrams, organizational charts, databases, ERDs, network diagrams, business charts, different thematic charts, schematics, infographics and plans developed specially for knowledge workers, engineers, managers, businessmen, marketing specialists, analytics, scientists, students, professors, journalists and also for a large number of other people that every day use various diagrams and drawings in their work and life activity. Each of these examples is a real art, all they are well thought-out and designed without efforts with help of powerful tools of ConceptDraw PRO software. ConceptDraw examples display all variety of tasks, possibilities and results that ConceptDraw Product Line lets achieve fast and easy. ConceptDraw is one of the best Visio alternatives for Mac. It open all Visio formats like .vsdx, .vss, .vdx files and allows you to export files to Visio formats.
 Biology
Biology solution extends ConceptDraw PRO software with samples, templates and libraries containing biological vector symbols, to help you create scientific and educational designs in the field of biology.
HelpDesk
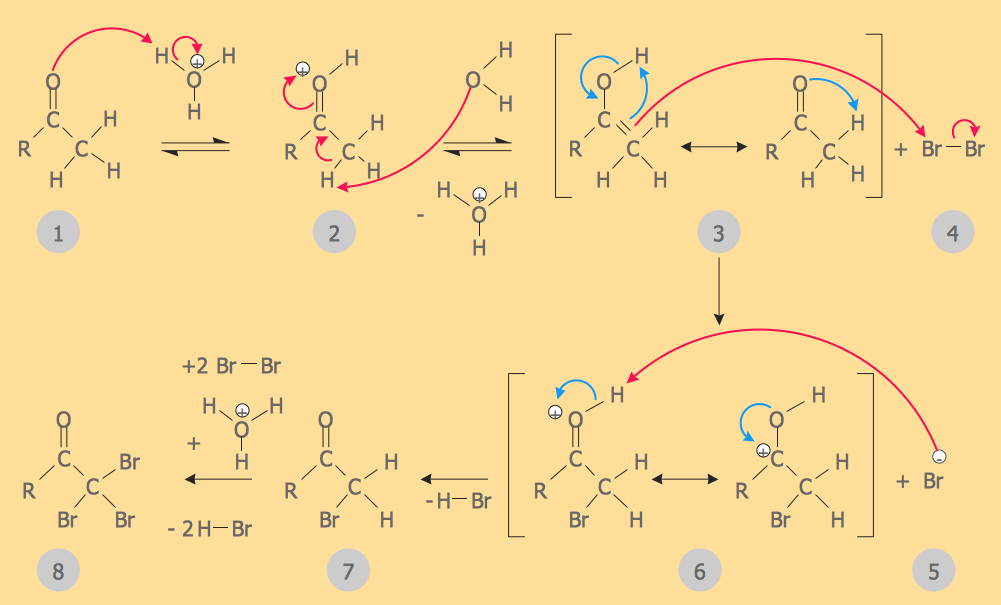
How to Draw Chemistry Structures
Making chemistry drawings for science and education purposes involves many different elements that can be managed using ConceptDraw PRO. ConceptDraw Chemistry solution can be used as a tool for creating chemical schemes and diagrams of chemical lab set-ups and labware, formulas, reaction schemes, and molecular structures. With ConceptDraw PRO you can easily create and communicate chemistry drawings of any complexity.
 Astronomy
Astronomy solution extends ConceptDraw PRO software with illustration and sketching software with templates, samples and libraries of a variety of astronomy symbols, including constellations, galaxies, stars, and planet vector shapes; a whole host of cele
 Chemistry
This solution extends ConceptDraw PRO software with samples, template and libraries of vector stencils for drawing the Chemistry Illustrations for science and education.
 Mathematics
Mathematics solution extends ConceptDraw PRO software with templates, samples and libraries of vector stencils for drawing the mathematical illustrations, diagrams and charts.
Business Diagram Software
When managing the projects, people, or networks, there are daily designed and used different types of Business diagrams, so the powerful drawing software will be very useful for this. ConceptDraw PRO with large quantity of business solutions will meet your needs and will help you convey your ideas successful and rapidly, no matter are you professional or beginner. It is the best choice for business specialists and technical professionals who need quickly and easily explore, visualize, and communicate information. ConceptDraw PRO business diagram software is the most powerful business software and relational charting software. Create advanced, completely customizable Business Process Diagrams, Business Flow Charts, Work Flow Diagrams, Organizational Charts, Audit diagrams, Marketing diagrams, Value Stream Maps, TQM diagrams, ERD diagrams, EPC diagrams, Cause and Effect diagrams, Infographics, Dashboards, and other Relational business diagrams from your data using the powerful drawing tools of ConceptDraw Solution Park.
- Professional Software For Scientific Workflow Mac
- How to Draw Biology Diagram in ConceptDraw PRO | Biology ...
- Sentence Diagram | Free Sentence Diagrammer | Workflow Diagram ...
- Process Flowchart | Best Program to Make Workflow Diagrams ...
- Basic Flowchart Symbols and Meaning | Flow Chart Symbols ...
- Scientific Method Flow Chart Graphics
- Basic Flowchart Symbols | LLNL Flow Charts | Cross-Functional ...
- A Example Of A Scientific Method Flow Chart
- Entity-Relationship Diagram (ERD) | Sentence Diagram | Workflow ...
- Free Sentence Diagrammer | Sentence Diagram | Workflow Diagram ...
- Biology Drawing Software | Biology Drawing | Biology | Biological ...
- Workflow Process Example | Contoh Flowchart | Biology | 5 Draw ...
- Quality Mind Map | Education Mind Maps | Mind Map Exchange ...
- Scientific Symbols Chart | Basic Flowchart Symbols and Meaning ...
- Venn Diagram Examples for Problem Solving. Computer Science ...
- Graphical Symbols to use in EPC diagrams | Flow Chart Symbols ...
- Types of Flowchart - Overview | Mathematics Symbols | Mathematics ...
- Bio Flowchart Lite | ConceptDraw Solution Park | Business Diagram ...
- Biology | Biology Drawing | Biology Drawing Software | Scientific ...
- Flowchart design. Flowchart symbols, shapes, stencils and icons ...


