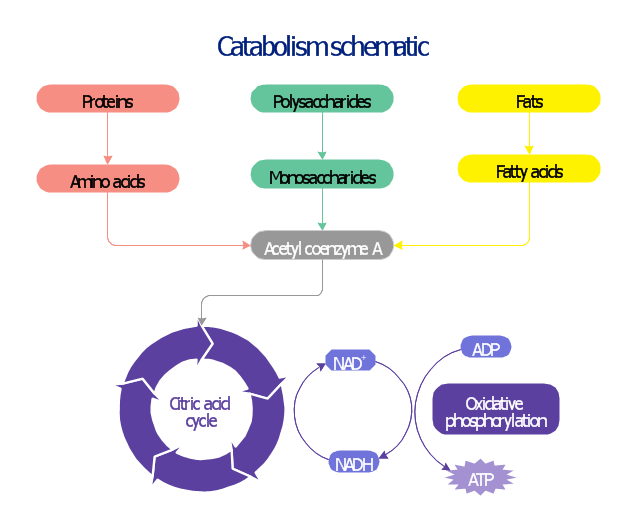
This biochemical chart display how proteins, polysaccharides and fats from food are digested into gastrointestinal tract into aminoacids, monosaccharides and fatty acids, and then broken down and oxidized to carbon dioxide and water in cellular processes of energy generation.
This metabolic pathway map was redesigned from Wikipedia file: Catabolism schematic.svg. [en.wikipedia.org/ wiki/ File:Catabolism_ schematic.svg]
The biochemical diagram example "Catabolism schematic" was created using the ConceptDraw PRO diagramming and vector drawing software extended with the Biology solution from the Science and Education area of ConceptDraw Solution Park.
Catabolic pathway map
 Biology
Biology solution extends ConceptDraw PRO software with samples, templates and libraries containing biological vector symbols, to help you create scientific and educational designs in the field of biology.
Basic Flowchart Symbols and Meaning


Ring Network Topology

Biology Drawing Software

"Carbohydrate catabolism is the breakdown of carbohydrates into smaller units. Carbohydrates literally undergo combustion to retrieve the large amounts of energy in their bonds. Energy is secured by mitochondria in the form of ATP.
There are several different types of carbohydrates: polysaccharides (e.g., starch, amylopectin, glycogen, cellulose), monosaccharides (e.g., glucose, galactose, fructose, ribose) and the disaccharides (e.g., maltose, lactose).
Glucose reacts with oxygen in the following redox reaction, C6H12O6 + 6O2 → 6CO2 + 6H2O, the carbon dioxide and water is a waste product and the chemical reaction is exothermic.
The breakdown of glucose into energy in the form of molecules of ATP is therefore one of the most important biochemical pathways found in living organisms." [Carbohydrate catabolism. Wikipedia]
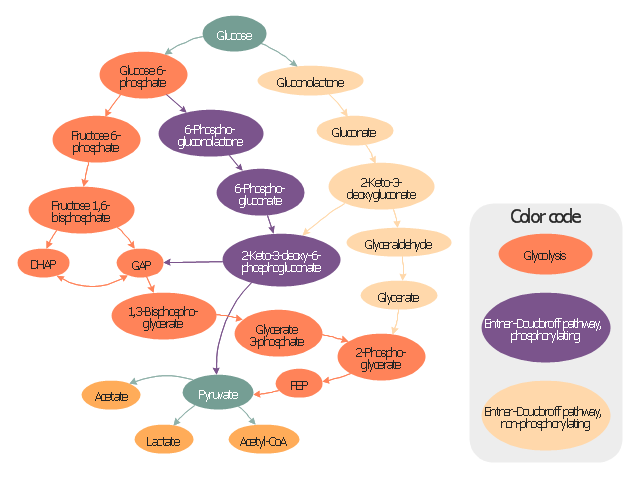
This glucose catabolism pathways map shows glycolysis by orange color, Entner-Doudoroff phosphorylating pathway by green color, Entner-Doudoroff non-phosphorylating pathway by Yellow color.
This methabolic pathway map was redesigned from Wikimedia file: Glucose catabolism pathways.svg. [commons.wikimedia.org/ wiki/ File:Glucose_ catabolism_ pathways.svg]
The biochemical diagram example "Glucose catabolism pathways map" was created using the ConceptDraw PRO diagramming and vector drawing software extended with the Biology solution from the Science and Education area of ConceptDraw Solution Park.
There are several different types of carbohydrates: polysaccharides (e.g., starch, amylopectin, glycogen, cellulose), monosaccharides (e.g., glucose, galactose, fructose, ribose) and the disaccharides (e.g., maltose, lactose).
Glucose reacts with oxygen in the following redox reaction, C6H12O6 + 6O2 → 6CO2 + 6H2O, the carbon dioxide and water is a waste product and the chemical reaction is exothermic.
The breakdown of glucose into energy in the form of molecules of ATP is therefore one of the most important biochemical pathways found in living organisms." [Carbohydrate catabolism. Wikipedia]
This glucose catabolism pathways map shows glycolysis by orange color, Entner-Doudoroff phosphorylating pathway by green color, Entner-Doudoroff non-phosphorylating pathway by Yellow color.
This methabolic pathway map was redesigned from Wikimedia file: Glucose catabolism pathways.svg. [commons.wikimedia.org/ wiki/ File:Glucose_ catabolism_ pathways.svg]
The biochemical diagram example "Glucose catabolism pathways map" was created using the ConceptDraw PRO diagramming and vector drawing software extended with the Biology solution from the Science and Education area of ConceptDraw Solution Park.
Catabolic pathway map
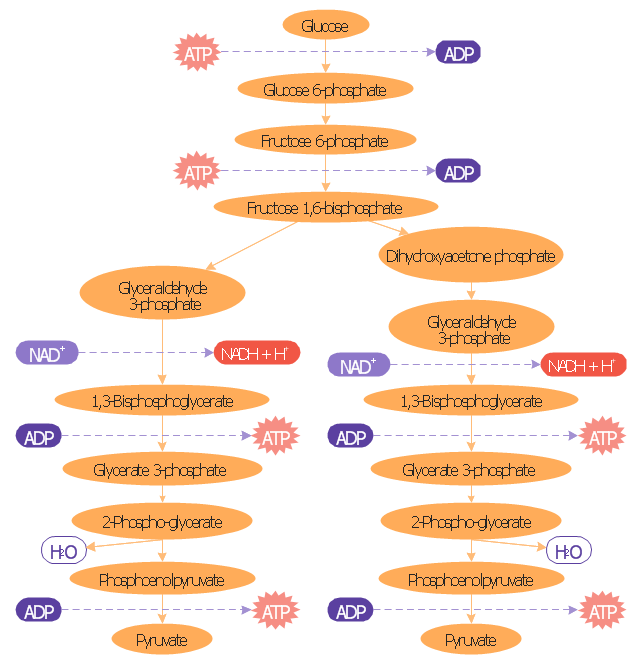
"Glycolysis is the metabolic pathway that converts glucose into pyruvate. The free energy released in this process is used to form the high-energy compounds ATP (adenosine triphosphate) and NADH (reduced nicotinamide adenine dinucleotide)." [Glycolysis. Wikipedia]
This biochemical diagram was redesigned from Wikimedia file: Glycolysis overview.svg. [commons.wikimedia.org/ wiki/ File:Glycolysis_ overview.svg]
The glucose metabolism diagram example "Glycolysis overview" was created using the ConceptDraw PRO diagramming and vector drawing software extended with the Biology solution from the Science and Education area of ConceptDraw Solution Park.
Glycolysis pathway map
Chemical Engineering

Biology Illustration

Entity Relationship Diagram Examples


- Schematic Pathway Of Glycolysis
- Catabolism schematic - Biochemical diagram | Metabolic pathway ...
- Metabolic pathway map - Biochemical diagram | Catabolism ...
- Metabolic pathway map - Biochemical diagram | Biology | Diagram ...
- Biology | Make Schematic Pathway To Show Various Pathways Of ...
- Schematic Representation Of The Glycolytic Pathway
- Biology | Design elements - TCA cycle | Catabolism schematic ...
- Biology | Download The Schematic Pathway Of Tricarboxylic Acid ...
- Diagram Of Glycolytic Pathway And Krebs Cycle
- Catabolism schematic - Biochemical diagram | Design elements ...