This TQM diagram sample was redesigned from the illustration of "Inland acid sulfate soil and water quality fact sheet" from website of the Department of the Environment of the Australian Government.
[environment.gov.au/ resource/ inland-acid-sulfate-soil-and-water-quality-fact-sheet]
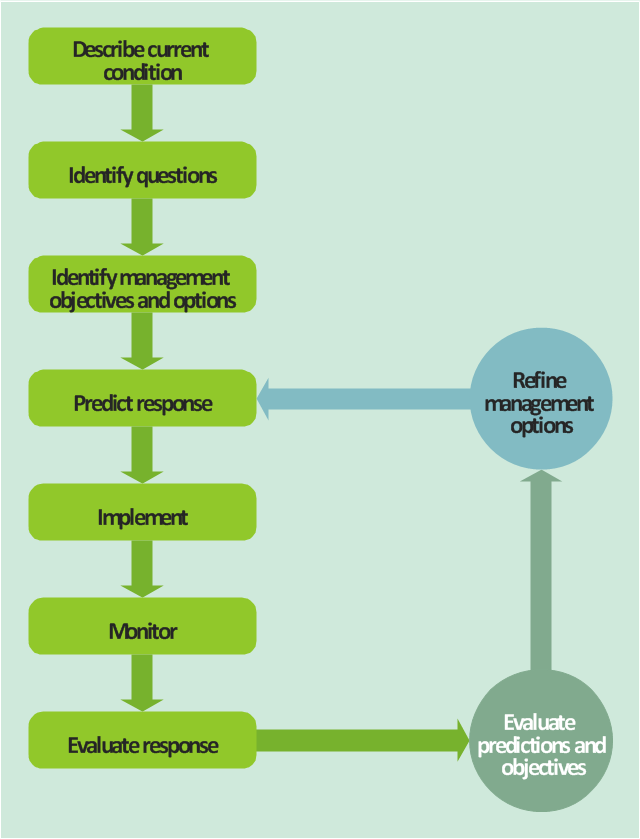
"Adaptive management (AM), also known as adaptive resource management (ARM), is a structured, iterative process of robust decision making in the face of uncertainty, with an aim to reducing uncertainty over time via system monitoring. In this way, decision making simultaneously meets one or more resource management objectives and, either passively or actively, accrues information needed to improve future management. Adaptive management is a tool which should be used not only to change a system, but also to learn about the system (Holling 1978). Because adaptive management is based on a learning process, it improves long-run management outcomes. The challenge in using the adaptive management approach lies in finding the correct balance between gaining knowledge to improve management in the future and achieving the best short-term outcome based on current knowledge (Allan & Stankey 2009)." [Adaptive management. Wikipedia]
The TQM flowchart example "Acid sulfate soil adaptive management framework" was created using the ConceptDraw PRO diagramming and vector drawing software extended with the Total Quality Management (TQM) Diagrams solution from the Quality area of ConceptDraw Solution Park.
[environment.gov.au/ resource/ inland-acid-sulfate-soil-and-water-quality-fact-sheet]
"Adaptive management (AM), also known as adaptive resource management (ARM), is a structured, iterative process of robust decision making in the face of uncertainty, with an aim to reducing uncertainty over time via system monitoring. In this way, decision making simultaneously meets one or more resource management objectives and, either passively or actively, accrues information needed to improve future management. Adaptive management is a tool which should be used not only to change a system, but also to learn about the system (Holling 1978). Because adaptive management is based on a learning process, it improves long-run management outcomes. The challenge in using the adaptive management approach lies in finding the correct balance between gaining knowledge to improve management in the future and achieving the best short-term outcome based on current knowledge (Allan & Stankey 2009)." [Adaptive management. Wikipedia]
The TQM flowchart example "Acid sulfate soil adaptive management framework" was created using the ConceptDraw PRO diagramming and vector drawing software extended with the Total Quality Management (TQM) Diagrams solution from the Quality area of ConceptDraw Solution Park.
TQM diagram
 Total Quality Management TQM Diagrams
Total Quality Management Diagrams solution extends ConceptDraw PRO software with samples, templates and vector stencils library for drawing the TQM flowcharts.
 Enterprise Architecture Diagrams
Enterprise Architecture Diagrams solution extends ConceptDraw PRO software with templates, samples and library of vector stencils for drawing the diagrams of enterprise architecture models.
IDEF9 Standard

 Bubble Diagrams
Bubble diagrams have enjoyed great success in software engineering, architecture, economics, medicine, landscape design, scientific and educational process, for ideas organization during brainstorming, for making business illustrations, presentations, planning, design, and strategy development. They are popular because of their simplicity and their powerful visual communication attributes.
 Fishbone Diagrams
The Fishbone Diagrams solution extends ConceptDraw PRO v10 software with the ability to easily draw the Fishbone Diagrams (Ishikawa Diagrams) to clearly see the cause and effect analysis and also problem solving. The vector graphic diagrams produced using this solution can be used in whitepapers, presentations, datasheets, posters, and published technical material.
 25 Typical Orgcharts
The 25 Typical Orgcharts solution contains powerful organizational structure and organizational management drawing tools, a variety of professionally designed organization chart and matrix organization structure samples, 25 templates based on various orga
- Framework Of Total Quality Management With Diagram
- Tqm Framework Diagram
- Total Quality Management TQM Diagrams | Acid sulfate soil ...
- Definition TQM Diagram | Total Quality Management Definition ...
- Total Quality Management TQM Diagrams | The Fifty Two Elements ...
- Acid sulfate soil adaptive management framework | Design elements ...
- Total Quality Management TQM Diagrams | Event-driven Process ...
- Bar Diagrams for Problem Solving. Create space science bar charts ...
- UML Class Diagram Example for GoodsTransportation System ...
- TQM Diagram Example | Definition TQM Diagram | Quality Control ...
- Organizational Structure Total Quality Management | Organizational ...
- Flowchart Of Type Of Soils With Example
- TQM Diagram Example | Definition TQM Diagram | Create TQM ...
- Flowchart of Products. Flowchart Examples | Accounting Data Flow ...
- Process Flowchart | TQM Software — Build Professional TQM ...
- Process Flowchart | Total Quality Management Value | Pyramid ...
- Tqm Building Block Model Diagram
- Process Flowchart | Total Quality Management Definition | Basic ...
- TQM Diagram Example | Total Quality Management TQM Diagrams ...
- Example Of Water Transportation