 Sales Dashboard
Sales Dashboard solution extends ConceptDraw DIAGRAM software with templates, samples and library of vector stencils for drawing the visual dashboards of sale metrics and key performance indicators (KPI).
Sales Dashboard

Dashboard

 Sales Dashboard
Sales Dashboard solution extends ConceptDraw DIAGRAM software with templates, samples and library of vector stencils for drawing the visual dashboards of sale metrics and key performance indicators (KPI).
Visualizes Vital Data From Sales

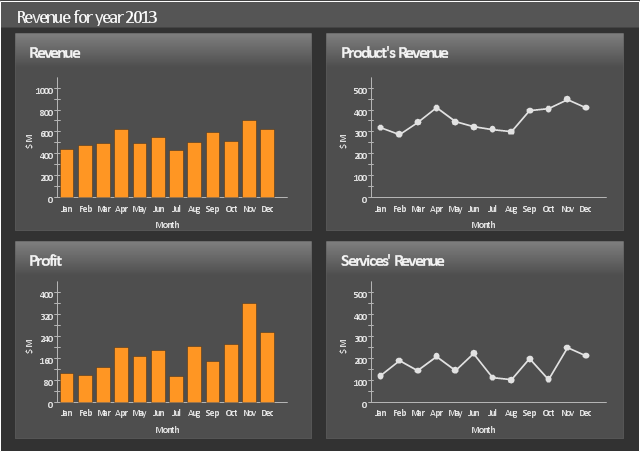
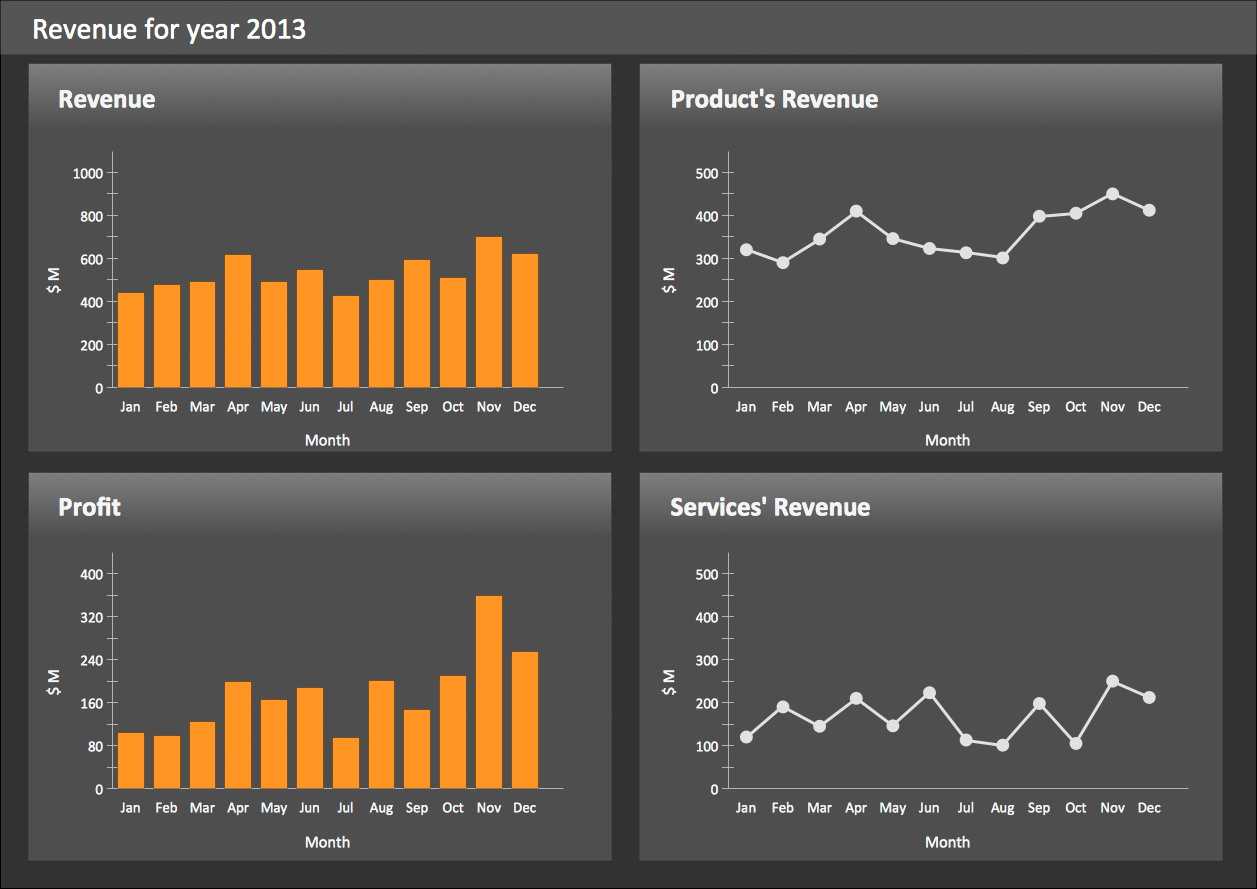
This sales dashboard sample shows how key performance parameters such as revenue, profit, product's revenue and product's profit change in time using bar charts and line graphs.
The dashboard example "Sales revenue" was created using the ConceptDraw PRO diagramming and vector drawing software extended with the Sales Dashboard solution from the Marketing area of ConceptDraw Solution Park.
The dashboard example "Sales revenue" was created using the ConceptDraw PRO diagramming and vector drawing software extended with the Sales Dashboard solution from the Marketing area of ConceptDraw Solution Park.
Sales dashboard
 Business Intelligence Dashboard
Business Intelligence Dashboard solution extends the ConceptDraw DIAGRAM functionality with exclusive tools, numerous ready-to-use vector objects, samples and quick-start templates for creation professional Business Intelligence Dashboards, Business Intelligence Graphics, Business Intelligence Charts and Maps of different kinds. Design easy the BI dashboard, BI model or Dynamic chart in ConceptDraw DIAGRAM to monitor the company's work, to track the indicators corresponding your company's data, to display and analyze key performance indicators, to evaluate the trends and regularities of the processes occurring at the company.
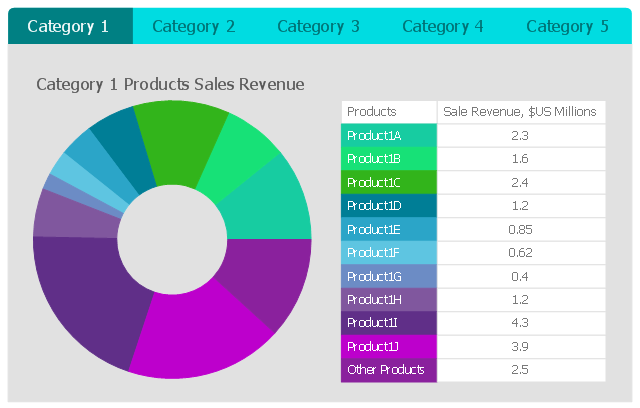
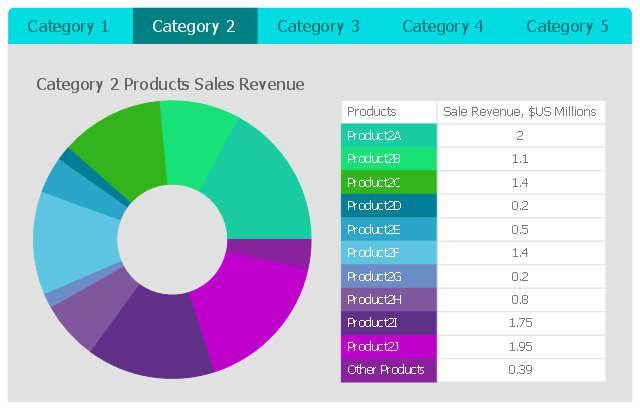
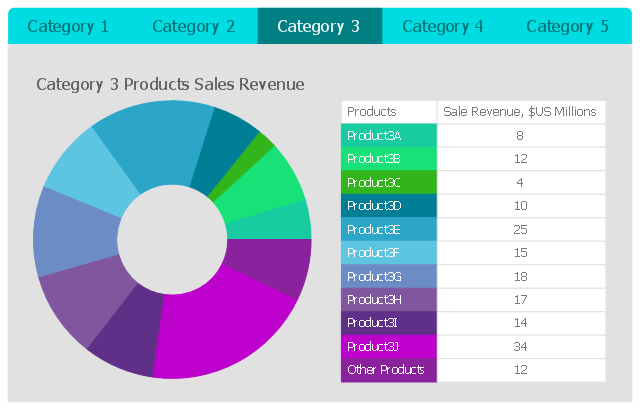
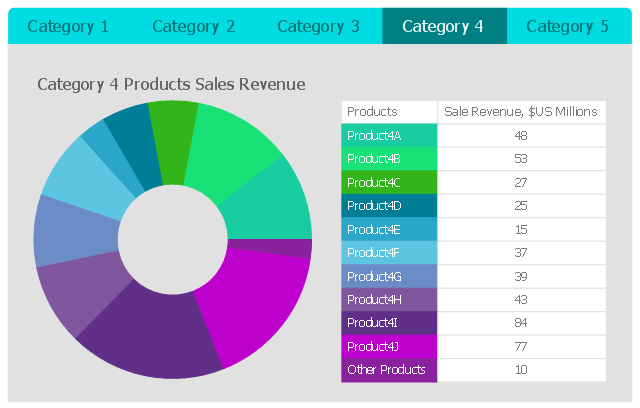
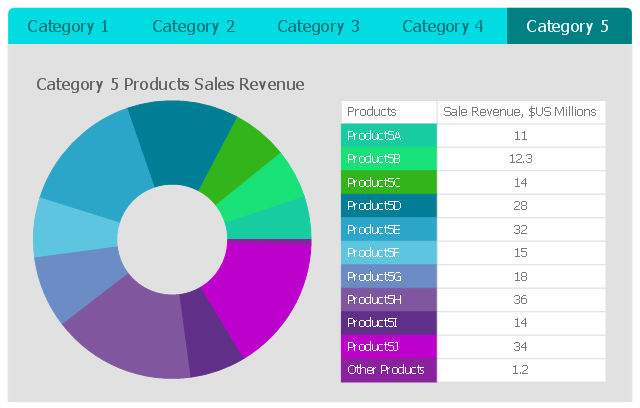
This business intelligence dashboard sample shows the quarter sales revenue for top 10 products by categories using donut charts.
"A doughnut chart (also spelled donut) is a variant of the pie chart, with a blank center allowing for additional information about the data as a whole to be included." [Pie chart. Wikipedia]
The BI dashboard example "Quarter Sales Revenue for Top 10 Products by Categories" was created using ConceptDraw PRO software extended with the Business Intelligence Dashboards solution from the Business Processes area of ConceptDraw Solution Park.
Category 1
Category 2
Category 3
Category 4
Category 5
 Meter Dashboard
Meter dashboard solution extends ConceptDraw DIAGRAM software with templates, samples and vector stencils library with meter indicators for drawing visual dashboards showing quantitative data.
KPI Dashboard

KPIs and Metrics

Performance Indicators

What is a KPI?
 Area Charts
Area Charts are used to display the cumulative totals over time using numbers or percentages; or to show trends over time among related attributes. The Area Chart is effective when comparing two or more quantities. Each series of data is typically represented with a different color, the use of color transparency in an object’s transparency shows overlapped areas and smaller areas hidden behind larger areas.
Pyramid Chart Examples

- Revenue Dashboard Examples
- Sales Dashboard | Sales revenue - Dashboard | Sales Process ...
- Revenue Kpi Examples
- Pie Chart Examples and Templates | Donut Chart Templates ...
- Revenue Cost Dashboard
- Cost Revenue Dashboard
- Process Flowchart | Sales Process Flowchart. Flowchart Examples ...
- Monthly Revenue In Dashboard
- Sales dashboard - Vector stencils library | Time series digital ...
- Process Flowchart | Sales Process Flowchart. Flowchart Examples ...
- Revenue Flow Chart Examples
- Sales metrics and KPIs - Visual dashboard | Sales KPIs ...
- Sales Growth. Bar Graphs Example | Bar Chart Template for Word ...
- Sales Dashboard | Process Flowchart | Sales Dashboard | Revenue ...
- Professions - Vector stencils library | Sales revenue - Dashboard ...
- Process Flowchart | Sales Process Flowchart. Flowchart Examples ...
- Revenue Chart Template
- Growth In Revenue
- Chart And Graph Examples On Sales
- Sales Dashboard Template | Visualize Sales Data Using Sample ...