Pyramid Diagram

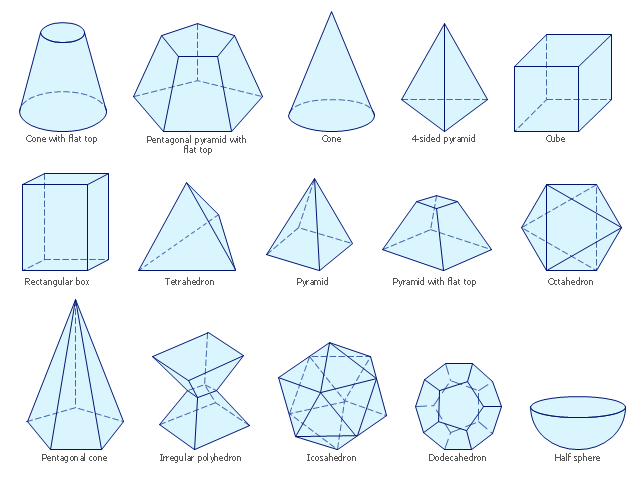
The vector stencils library "Solid geometry" contains 15 shapes of solid geometric figures.
"In mathematics, solid geometry was the traditional name for the geometry of three-dimensional Euclidean space - for practical purposes the kind of space we live in. It was developed following the development of plane geometry. Stereometry deals with the measurements of volumes of various solid figures including cylinder, circular cone, truncated cone, sphere, and prisms.
The Pythagoreans had dealt with the regular solids, but the pyramid, prism, cone and cylinder were not studied until the Platonists. Eudoxus established their measurement, proving the pyramid and cone to have one-third the volume of a prism and cylinder on the same base and of the same height, and was probably the discoverer of a proof that the volume of a sphere is proportional to the cube of its radius." [Solid geometry. Wikipedia]
The shapes example "Design elements - Solid geometry" was created using the ConceptDraw PRO diagramming and vector drawing software extended with the Mathematics solution from the Science and Education area of ConceptDraw Solution Park.
Solid geometrical figures
Six Markets Model Chart

Sales Growth. Bar Graphs Example

Business Productivity - Marketing

Pie Chart Software

 Workflow Diagrams
Workflow Diagrams solution extends ConceptDraw PRO software with samples, templates and vector stencils library for drawing the work process flowcharts.
 AWS Architecture Diagrams
The flexible AWS cloud solutions will help you to create reliable applications with a high level of scaling in the AWS cloud, to run your applications and accelerate their work on the level of security. Besides AWS resources are available worldwide and yo
 Mechanical Engineering
This solution extends ConceptDraw PRO v.9 mechanical drawing software (or later) with samples of mechanical drawing symbols, templates and libraries of design elements, for help when drafting mechanical engineering drawings, or parts, assembly, pneumatic,
- Design elements - Solid geometry | Solid geometry - Vector stencils ...
- Design elements - Solid geometry | Solid geometry - Vector stencils ...
- Pyramid Geometrical Figures
- Solid geometry - Vector stencils library | Mathematics Symbols ...
- Design elements - Solid geometry | Solid geometry - Vector stencils ...
- Design elements - Solid geometry | Solid geometry - Vector stencils ...
- Solid geometry - Vector stencils library | Design elements - Solid ...
- Polyhedron Pyramid
- Flat Pyramid Structure
- Solid geometry - Vector stencils library | Design elements - Solid ...
- Solid geometry - Vector stencils library | Solid geometry - Vector ...
- Solid Figure Of Geometry
- Prism Geometric Shape
- Pyramid Diagram | Design elements - Solid geometry | Design ...
- Solid geometry - Vector stencils library | How to Draw Geometric ...
- Process Flowchart | Pyramid Diagram | Advertising - Vector stencils ...
- Pyramid Diagram | Sales KPIs and Metrics - Vector stencils library ...
- Advertising - Vector stencils library | Conventional and wireless ad ...
- Design elements - Solid geometry | Mathematics | Solid geometry ...
- Solid geometry - Vector stencils library | Platonic solids | Design ...