This site uses cookies. By continuing to browse the ConceptDraw site you are agreeing to our Use of Site Cookies.

Flowchart Software

Flowchart is widely used in business, education and economic presentations to help the audience visualize the content better, or to find flaws in a process flow diagrams. Flowcharts are particularly useful for displaying how a process currently flow or could ideally function. Flowcharts can help you see whether the steps of a process are logical, uncover problems or miscommunications, define the boundaries of a process, and develop a common base of knowledge about a process.

ConceptDraw DIAGRAM flowchart software will help to quickly create new flowcharts, workflow, NS Diagram, BPMN Diagram, Cross-functional flowcharts, data flow diagrams and highlight flowcharts.

Feature-rich flowchart maker, free thousand flowchart examples and templates and colored symbols that will allow you to create professional looking flowcharts simply.

ConceptDraw DIAGRAM supports macOS and Windows.
How to Build a Flowchart

SWOT Matrix Template

A SWOT analysis can be carried out for a product, place, industry or person. It involves specifying the objective of the business venture or project and identifying the internal and external factors that are favorable and unfavorable to achieving that objective.

Flow chart Example. Warehouse Flowchart

Warehouse Flowcharts are different diagrams describing wharehousing and inventory menagement processes. Typical purposes of warehouse flowcharts are evaluating warehouse performance and organizational performance, measuring efficiency of customer service. This type of workflow diagrams can be used for identifying any disconnection between business activities and business objectives.
Standard warehousing process flow diagram and standard workflow diagram used for process identification for further evaluating effectiveness and profitability of overall business process. Use the ConceptDraw DIAGRAM diagramming and vector drawing software extended with the Flowcharts solution from the Diagrams area of ConceptDraw Solution Park to design your own workflow diagrams, process flow diagram and flow charts. Need to use Process Flow Diagram for designing Warehouse packages flow.
ConceptDraw Arrows10 Technology

Process Flow Diagram Symbols

Chemical and Process Engineering solution contains variety predesigned process flow diagram elements relating to instrumentation, containers, piping and distribution necessary for chemical engineering, and can be used to map out chemical processes or easy creating various Chemical and Process Flow Diagrams in ConceptDraw DIAGRAM.

integration definition, database design, object-oriented design, idef IDEF Business Process Diagrams

integration definition, database design, object-oriented design, idef
Use the IDEF Business Process Diagrams solution to create effective database designs and object-oriented designs, following the integration definition methodology.
HelpDesk

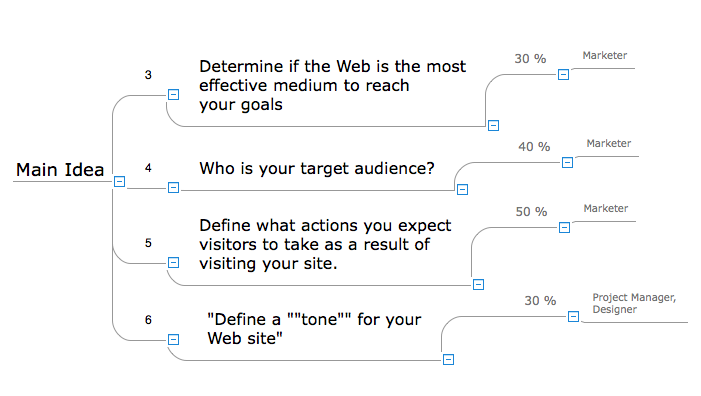
How to Input Data from MS Excel Into a Mind Map

Many people apply Excel documents to store data in the form of hierarchical lists. With ConceptDraw MINDMAP you can easily turn the linear structure of an Excel table in a radial structure of mind map ConceptDraw MINDMAP will create a mind map file (CDMZ) from your Excel (XLS) file. If you keep your information in the Microsoft Excel files, you can import them into ConceptDraw MINDMAP, converting the columns and rows to a hierarchically structured mind map. If you have multiple individual sheets in your Excel workbook, ConceptDraw MINDMAP will turn them into a single multi-page mind map. ConceptDraw MINDMAP lets you import an entire Microsoft® Excel file as well as insert data from the selected cells.

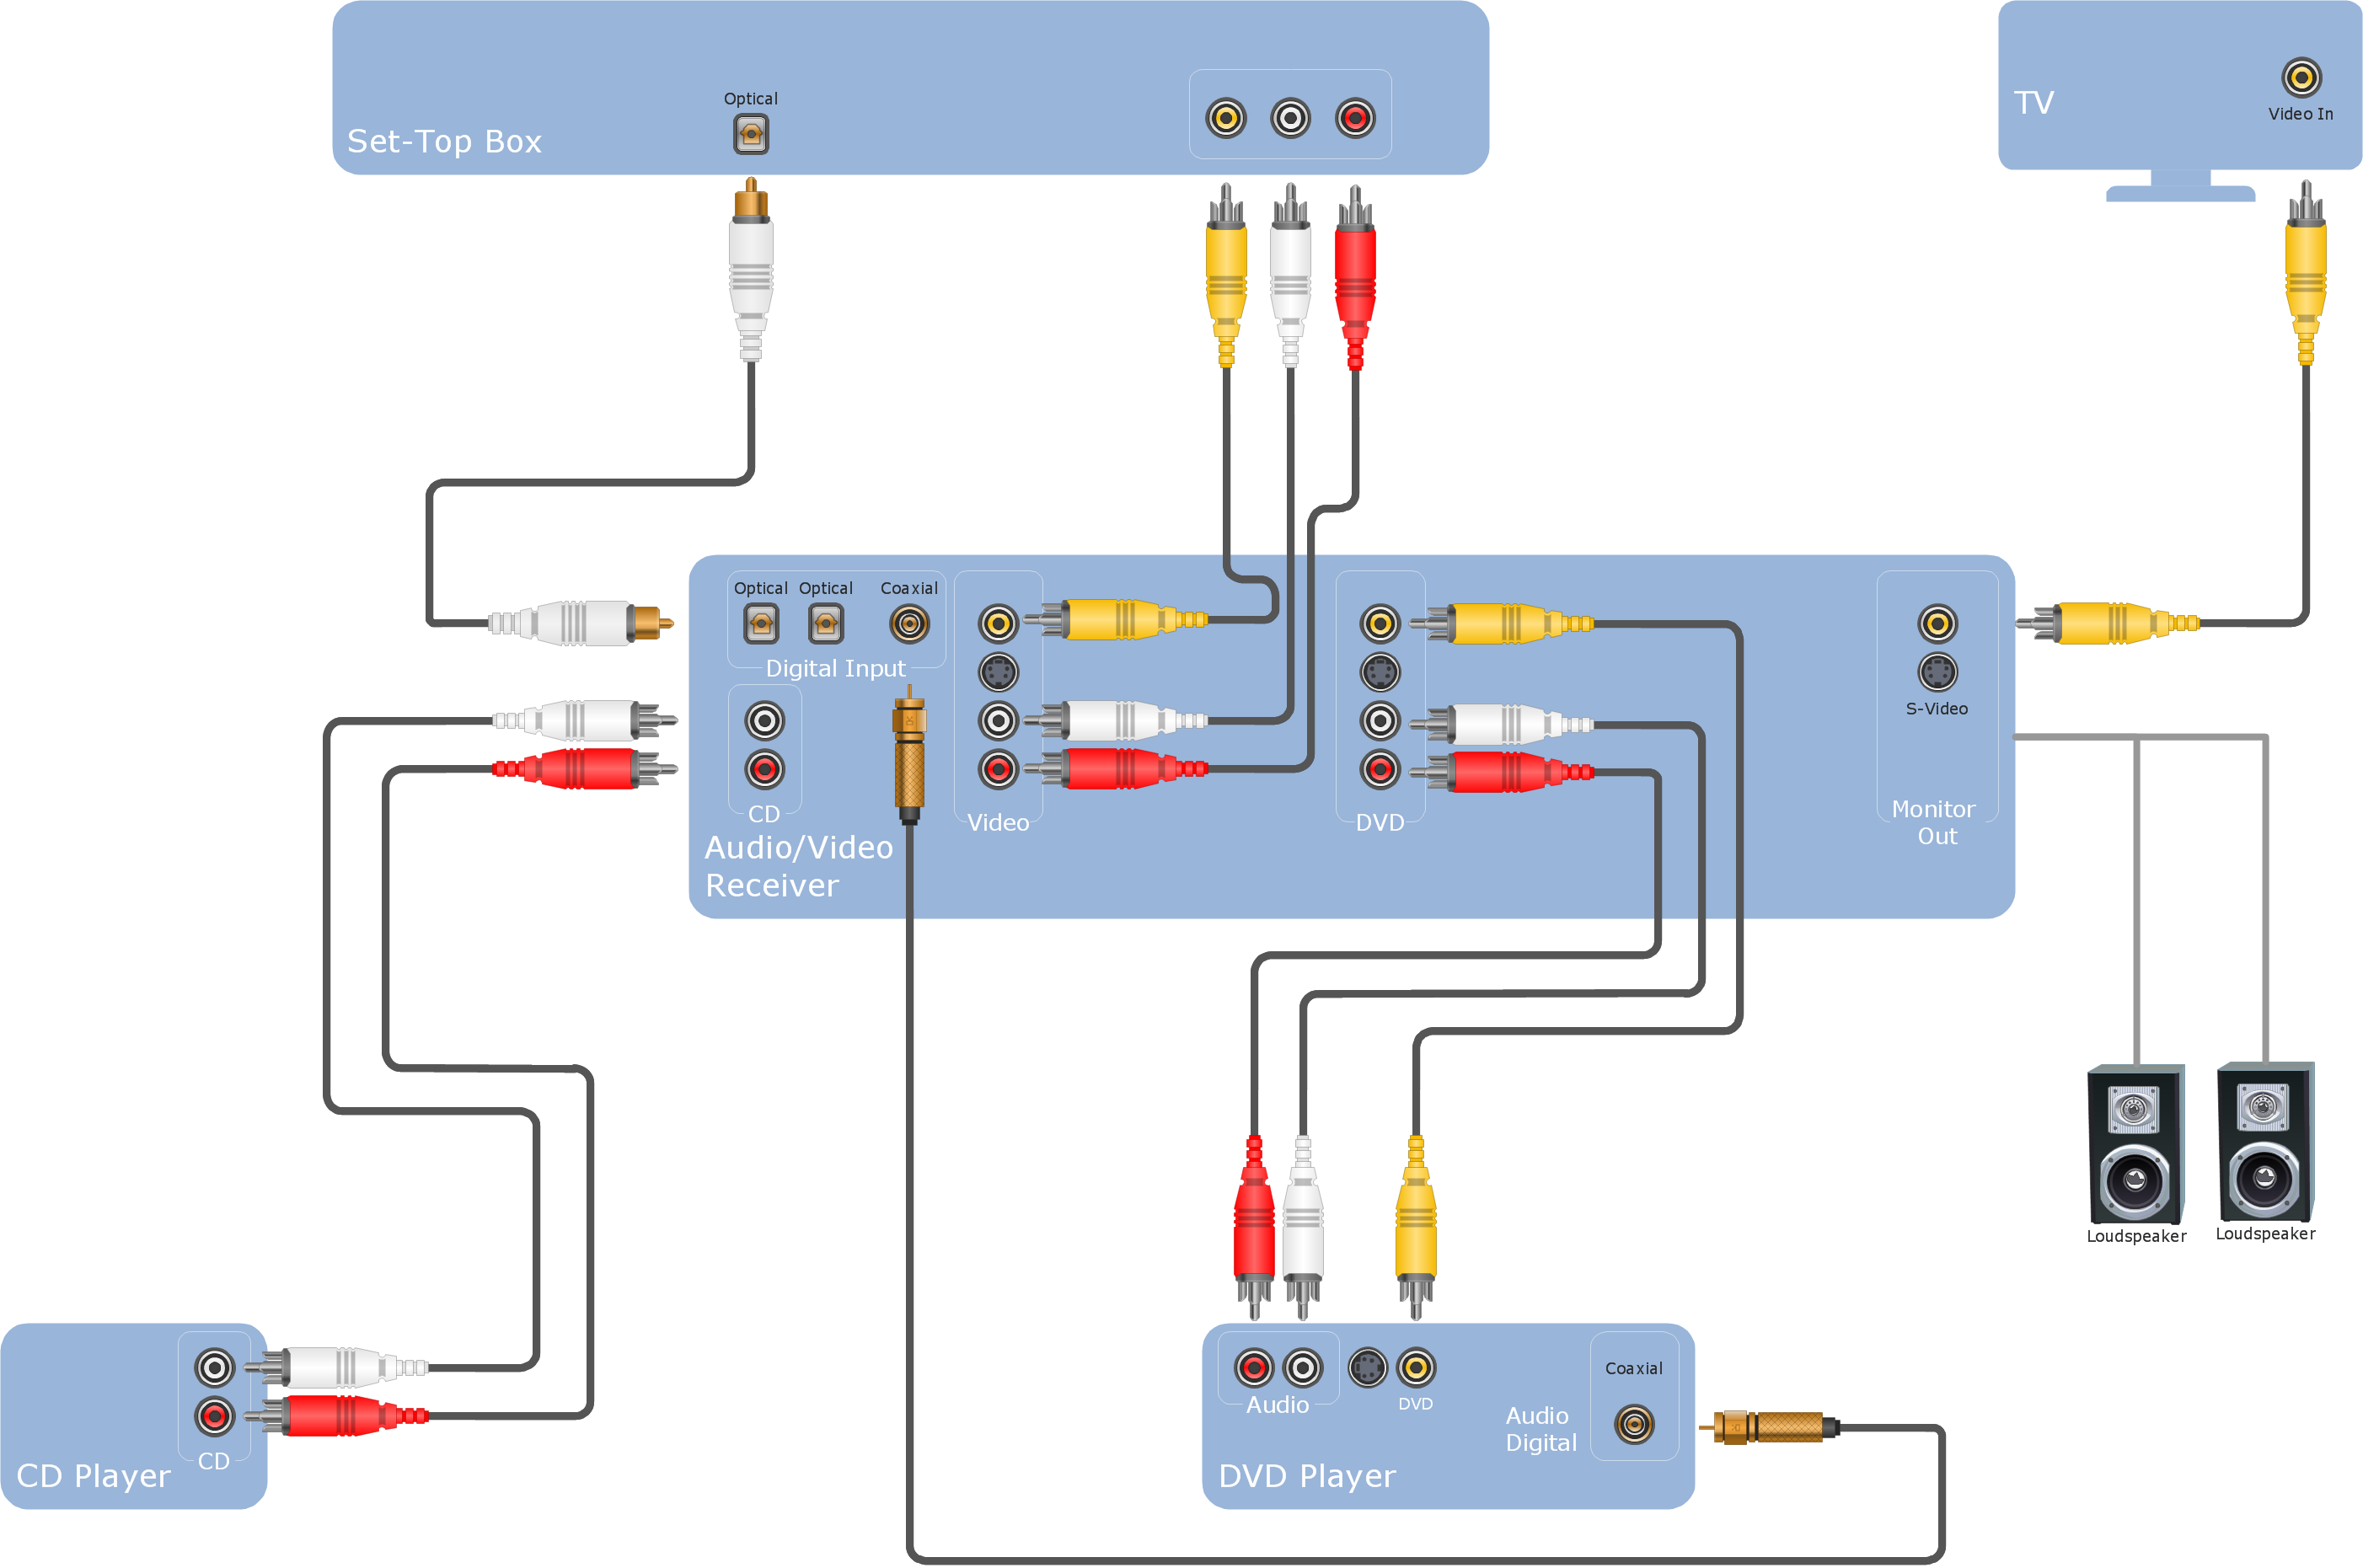
Audio Visual Cables and Connectors

The Audio & Video Connectors solution contains a set of pre-designed objects, libraries, templates, and samples; allowing quick and easy diagramming of various configurations of audio and video devices.
HelpDesk

How To Create an HR Metric Dashboard

Human Resources dashboards can be used for analyzing hr workflow in an organization and identifying points for improvement. They are useful to HR managers, and for C level executives. HR dashboard helps to monitor HR KPIs. Thus Decision makers will ensure that company strategy is aligned from an executive, to managerial, to individual goals. HR Dashboard Solution for ConceptDraw DIAGRAM allows you to see what information you need from each KPI to see if your Human Resources management performs accurate and cost-efficient.

BPMN, BPMN 2.0, business process model and notation Business Process Model and Notation

BPMN, BPMN 2.0, business process model and notation
Business Process Model and Notation Solution for ConceptDraw DIAGRAM is helpful for modeling the business processes of any degree of complexity, documenting them and effective creating diagrams using the BPMN 2.0 standard.