Process Flowchart


Process Engineering

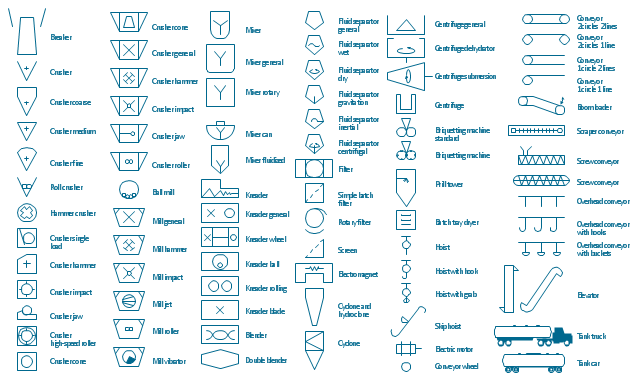
The vector stencils library "Chemical engineering" contains 24 symbols of chemical and process engineering equipment.
Use these shapes for drawing block flow diagrams (BFD), process flow diagrams (PFD), piping and instrumentation diagrams (P&ID), and water flow diagrams.
"Chemical engineering is a branch of engineering that applies the natural (or experimental) sciences (e.g., chemistry and physics) and life sciences (e.g. biology, microbiology and biochemistry) together with mathematics and economics to production, transformation, transportation and proper usage of chemicals, materials and energy. It essentially deals with the engineering of chemicals, energy and the processes that create and/ or convert them. Modern chemical engineers are concerned with processes that convert raw-materials or (cheap)chemicals into more useful or valuable forms. In addition, they are also concerned with pioneering valuable materials and related techniques – which are often essential to related fields such as nanotechnology, fuel cells and bioengineering. Within chemical engineering, two broad subgroups include design, manufacture, and operation of plants and machinery in industrial chemical and related processes ("chemical process engineers") and development of new or adapted substances for products ranging from foods and beverages to cosmetics to cleaners to pharmaceutical ingredients, among many other products ("chemical product engineers")." [Chemical engineering. Wikipedia]
The example "Design elements - Chemical engineering" was created using the ConceptDraw PRO diagramming and vector drawing software extended with the Chemical and Process Engineering solution from the Engineering area of ConceptDraw Solution Park.
Chemical engineering symbols

 Fault Tree Analysis Diagrams
This solution extends ConceptDraw DIAGRAM.5 or later with templates, fault tree analysis example, samples and a library of vector design elements for drawing FTA diagrams (or negative analytical trees), cause and effect diagrams and fault tree diagrams.
 Pharmacy Illustrations
Pharmacy Illustrations solution with improbable quantity of predesigned vector objects and icons of pharmacy symbols, medical and health products, pharmacy images of drugstore products, pharmacy clipart of medication tools, pharmacy logo, and other pharmacy pictures is the best for designing the pharmacy illustrations of varied kinds, pharmacy and medical diagrams and schematics, for making the presentation slides and posters on the medical, pharmacy, pharmacology and pharmaceutical thematics, for designing the illustrative materials about ways of prevention diseases and also treatment them, for creation colorful illustrations helpful in newborn and baby care, the infographics and collages to be presented at the premises of medical establishments and during the lectures at the medical education institutions, also on the billboards and in other advertising materials.
 Medical Illustrations
Medical Illustrations solution including the set of professionally developed examples and samples dedicated to medicine, large variety of ready-to-use vector objects and icons of diagnostic equipment, treatment equipment, medical instruments, tools and devices, medical professionals and health workers of different medical specialties, medical procedures and patients, medical pictograms and medical symbols, among which are the famous red cross symbol, heartbeat symbol, doctor symbol, and many others, is a perfect help in questions of medical illustration and medical imaging, creation professional-looking, colorful and attractive Medical illustrations, Medical diagrams and infographics, slides for presentations in a field of medicine and health care, depicting the medical facts, the information about varied diseases and ways of medical diagnosis, methods of prevention and treatment diseases.
Decision Making


The vector stencils library "Industrial equipment" contains 81 symbols of pumps, compressors, fans, turbines, and power generators.
Use these shapes to design pumping systems, air and fluid compression systems, and industrial process diagrams.
"Process engineering focuses on the design, operation, control, and optimization of chemical, physical, and biological processes. Process engineering encompasses a vast range of industries, such as chemical, petrochemical, mineral processing, advanced material, food, pharmaceutical, and biotechnological industries. The application of systematic computer-based methods to process engineering is process systems engineering." [Process engineering. Wikipedia]
The example "Design elements - Industrial equipment" was created using the ConceptDraw PRO diagramming and vector drawing software extended with the Chemical and Process Engineering solution from the Engineering area of ConceptDraw Solution Park.
Industrial equipment symbols
Influence Diagram

 Healthcare Management Workflow Diagrams
Healthcare Management Workflow Diagrams solution contains large set of colorful samples and libraries with predesigned vector pictograms and symbols of health, healthcare equipment, medical instruments, pharmaceutical tools, transport, medication, departments of healthcare organizations, the medical icons of people and human anatomy, as well as the predesigned flowchart objects, connectors and arrows, which make it the best for designing clear and comprehensive Medi?al Workflow Diagrams and Block Diagrams, Healthcare Management Flowcharts and Infographics, Healthcare Workflow Diagram, for depicting the healthcare workflow and clinical workflows in healthcare, for making the workflow analysis healthcare and healthcare workflow management.
 Health Package
Health Package is a set of multifaceted solutions intended for visualization and illustration in a field of medicine and health, for drawing colorful, interesting and precise illustrations and infographics that will be used successfully in medical documents, articles, special magazines, posters, billboards, websites, presentations, collages. Having these solutions available, it will not be difficult to illustrate the medical editions, to convey the information in a full and interesting form, to teach students with use effective visual methods, to describe the medical facts, to tell about innovations in a field of medicine, health and correct nutrition, to explain the causes and consequences of different diseases, as well as the measures of their prevention and treatment.
Fault Tree Diagram

 Line Graphs
How to draw a Line Graph with ease? The Line Graphs solution extends the capabilities of ConceptDraw DIAGRAM with professionally designed templates, samples, and a library of vector stencils for drawing perfect Line Graphs.
The vector stencils library "Fault tree analysis diagrams" contains 12 symbols for drawing Fault Tree Analysis (FTA) diagrams.
"Fault tree analysis (FTA) is a top down, deductive failure analysis in which an undesired state of a system is analyzed using Boolean logic to combine a series of lower-level events. This analysis method is mainly used in the fields of safety engineering and reliability engineering to understand how systems can fail, to identify the best ways to reduce risk or to determine (or get a feeling for) event rates of a safety accident or a particular system level (functional) failure. FTA is used in the aerospace, nuclear power, chemical and process, pharmaceutical, petrochemical and other high-hazard industries; but is also used in fields as diverse as risk factor identification relating to social service system failure.
In aerospace, the more general term "system Failure Condition" is used for the "undesired state" / Top event of the fault tree. These conditions are classified by the severity of their effects. The most severe conditions require the most extensive fault tree analysis. These "system Failure Conditions" and their classification are often previously determined in the functional Hazard analysis." [Fault tree analysis. Wikipedia]
The shapes example "Fault tree analysis diagrams" was created using the ConceptDraw PRO diagramming and vector drawing software extended with the Fault Tree Analysis Diagrams solution from the Engineering area of ConceptDraw Solution Park.
FTA diagram symbols

 Health Sciences
Health Sciences solution including professionally designed samples and wide range of high-quality vector icons and pictograms of basic medical sciences, surgery specializations, internal medicine, medical diagnostics, interdisciplinary fields, mental health, obstetrics and gynecology, public health, allied health, and other medical specialties, is a perfect assistant in drawing Health diagrams, schematics, illustrations, infographics and slides for presentations on the healthcare, medical and health sciences thematic, in development knowledge in health science, in studying and representing the physical, mental and social aspects of human health, in determining the role of different health sciences at this process, finding and explaining new methods of treatment different diseases, making an overview and describing the main characteristics of health sciences in a visual form.
 Biomedicine
Biomedicine solution extends ConceptDraw DIAGRAM ector diagramming software with abundance of samples and libraries of vector biomedical icons, pictograms of biomedical sciences and biomedical technologies, the main purpose of which is to help biomedical doctors, biomedical researchers, scientific professionals, professors in biomedical science, technicians, lectors, students to describe visually and to illustrate new achievements and new technologies in biomedical science, results of experiments and tests at this field, to depict the history of biomedicine development, the stages and progress at this field, to plan future biomedicine technologies and to describe those that are now in development or on the stage of testing the biomedical technology by biomedical specialists, to design colorful and professionally looking illustrations, diagrams, presentation slides and infographics in fields of biomedicine, personalized medicine, regenerative medicine, molecular medicine, evidence-based medicine, reconstructive biomedicine, and preventive health care.
Geo Map — Europe — Germany

- Pharmaceutical Industry Process Flow Diagram
- How To Degine A Pharmaceutical Industry Flow Chart
- Preparation Of Flow Diagram In Pharmaceutical Industry
- Work Flow Chart Of Pharmaceutical Company
- Flow Diagram In Pharmaceutical Industry
- Pharmaceutical Industry Process Flow Chart
- Process Flowchart | Fault Tree Analysis Diagrams | Healthcare ...
- Pharmaceutical Company Process Flow
- Process Flowchart | Process Engineering | Fault Tree Analysis ...
- Diagram Of Pharmaceutical Industry
- Process Flow Diagram Of Pharma Industry For Unit Operations
- Process Flow Diagram Of A Pharmaceutical Company
- Process Flowchart | Pharma Plant Equipment Symbols
- Process Flowchart | Flow chart Example. Warehouse Flowchart ...
- How to Draw a Chemical Process Flow Diagram | Pharmaceutical ...
- Process Flowchart | Flow chart Example. Warehouse Flowchart ...
- Flow Chart Of Operation In Pharmaceutical Industry
- Process Flowchart | IVR services | Flow chart Example. Warehouse ...
- Tree Diagram Of Department Of Pharmaceutical Industry
- Process Flowchart | Functional Block Diagram | Design An Erd For ...