HelpDesk
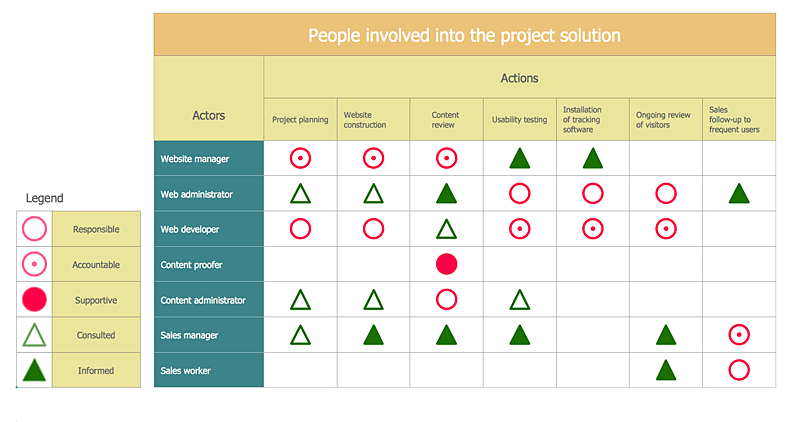
How To Create an Involvement Matrix
The Involvement Matrix can identify the distribution of responsibilities and identify roles in a group or team. This matrix can be used company wide. The Involvement Matrix identifies participants who are involved in corrective actions. The Involvement Matrix is constructed for all highly prioritized corrective actions. It uses symbols to assign who participates, performs, consults, should be informed, checks the work, and accepts the results. Using visual diagrams keeps ideas clear and is very effective when discussing the problem and a description of the solution. They are great at helping to quickly see what stage of the problem-solving effort is currently underway.It defines the participants and their roles. The matrix displays all of the parties involved, defines their level of involvement, and the nature of their participation. The ability to create an Involvement Matrix is supported by the ConceptDraw Seven Management and Planning Tools solution.HelpDesk
How to Manage Problem Solving Using Seven Management and Planning Tools
Stage by stage gouide on using visual tools to move toward solving the problem.
HelpDesk
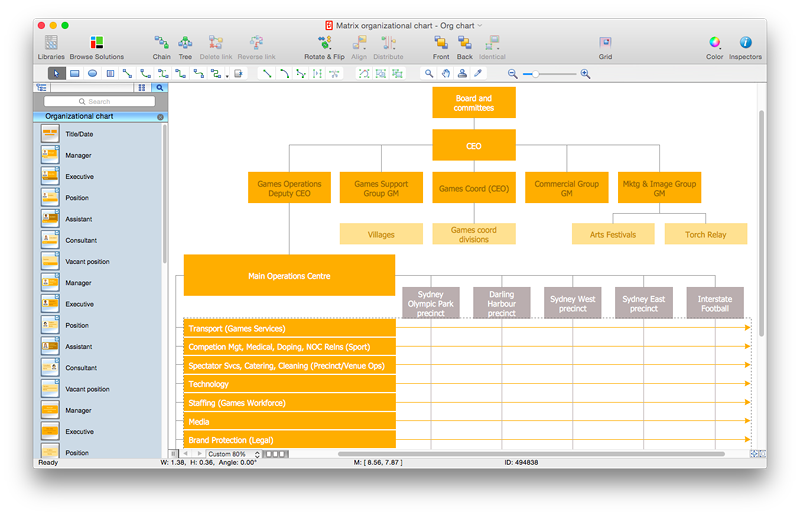
How to Draw a Matrix Organizational Chart with ConceptDraw PRO
There are a number of moments which are influenced on how the organizational structure of a certain business needs to be, how complex, and which type it should keep. The matrix organizational structure is atypical because it brings together employees and managers from different departments to work toward accomplishing a goal. This structure is commonly found in businesses that have more than one line of reportage. For instance, a company might contain an engineering department with engineering managers who workers report to. However, these workers might also have to liaise with different product or project managers depending on current tasks. Some form of matrix organization is found in most large-scale modern businesses. It is one of the most complicated reporting structures. You can easily build a clear matrix organizational chart in ConceptDraw PRO using templates from ConceptDraw Solution Park.Cross Functional Flowchart for Business Process Mapping
Start your business process mapping with conceptDraw PRO and its Arrows10 Technology. Creating a process map, also called a flowchart, is a major component of Six Sigma process management and improvement. Use Cross-Functional Flowchart drawing software for business process mapping (BPM). Use a variety of drawing tools, smart connectors and shape libraries to create flowcharts of complex processes, procedures and information exchange. Define and document basic work and data flows, financial, production and quality management processes to increase efficiency of you business.- Authority Matrix Diagram Software | Pyramid Diagram | PROBLEM ...
- Authority Matrix Diagram Software | SWOT Matrix Template ...
- SWOT Matrix Template | Authority Matrix Diagram Software ...
- Action Matrix
- PROBLEM ANALYSIS. Prioritization Matrix | Prioritization Matrix ...
- PROBLEM ANALYSIS. Prioritization Matrix | CORRECTIVE ...
- Authority Matrix Diagram Software | PROBLEM ANALYSIS ...
- Corrective Action Planning | PROBLEM ANALYSIS. Prioritization ...
- How To Create an Involvement Matrix | CORRECTIVE ACTIONS ...
- How To Create an Involvement Matrix | Matrix Organization Structure ...
- CORRECTIVE ACTIONS PLANNING. Involvement Matrix | Process ...
- Authority Matrix Diagram Software | PROBLEM ANALYSIS ...
- Seven Management and Planning Tools | PROBLEM ANALYSIS ...
- ERD Symbols and Meanings | Pyramid Diagram | Matrix ...
- SWOT Analysis Solution - Strategy Tools | Four-quadrant matrix ...
- SWOT Matrix Template | SWOT Analysis Solution - Strategy Tools ...
- Involvement matrix - Sale problem solution | Person involvement ...
- PROBLEM ANALYSIS. Prioritization Matrix | Person involvement ...
- Decision Making | PROBLEM ANALYSIS. Prioritization Matrix ...
- Develop A Computer Problem Cause Algorithm Flow Chart For


