HelpDesk
How to Create a Sales Flowchart Using ConceptDraw PRO
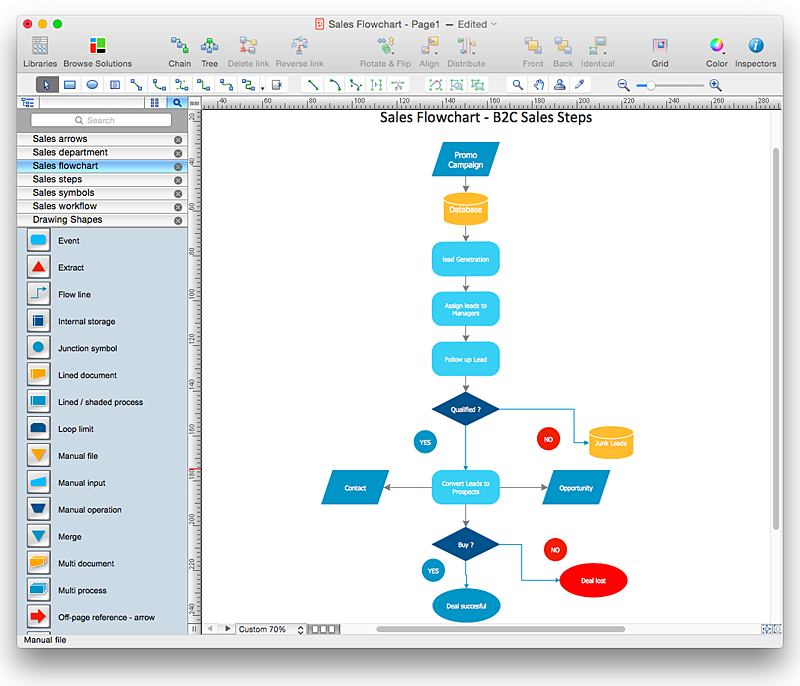
A Sales flowchart is a specialized type of flowchart. With the help of a sales flowchart you can visually describe tasks, documents, people responsible for execution at each stage of the sales process. For most commercial organizations, the sales process is inherent to its existence and ability to create profit. Although each company will achieve this aim in its own way, the core selling process remains similar throughout — a potential buyer or prospective customer exchanges money with an organization in return for goods or services. Despite this rather simplistic definition, there exists huge scope as to which approach is taken. Indeed, it is not uncommon for the sales division to be the largest within a corporate structure, employing a team of salespeople, analysts, and the sales managers, who are in charge of sales division operations.The practical applications of sales process flowcharts are numerous and wide ranging. At sales level, you might map the process of customer interactWhat is a Cross Functional Flow Chart?
For those who want to know what is a cross functional flowchart and how to draw it, we preared a special library and professional looking templates. Take all the advantage of your drawing software to learn and create such a well-designed flowcharts. Watch the HowTo video to learn more.HelpDesk
How to Draw a Pictorial Chart in ConceptDraw PRO
Pictorial Infographics is used to visually present data comparison. Pictorial charts use relative sizes or repetitions of the same icon, picture, or symbol to show data relation. Using a Pictorial chart to show business data patterns and trends will add much more efficiency to your business communications. Finding the right tool for the job can sometimes be tricky. Developing sophisticated and effective infographics can require toolsthat may span many different products. Fortunately, ConceptDraw PRO has everything you need to create polished Pictorial Infographics that beautifully and accurately represent your story, no matter how complex it may be.HelpDesk
How To Create an Affinity Diagram Using ConceptDraw Office
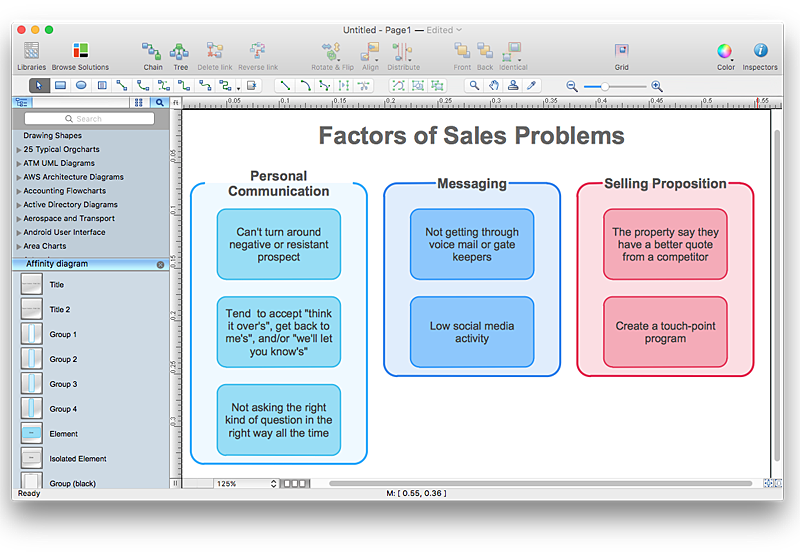
Affinity diagram is designed to prepare the data for further analysis of the cause-effect relationships.The Affinity diagram shows the structure of large, complex factors that have an influence on a problem, and then divides them up into a smaller and simpler structure. We recommend using a mind map for Brainstorming and collecting the factors affecting the problem. The ability to create an Affinity diagram from a mind map is supported by the ConceptDraw Seven Management and Planning Tools solution.Vertical Cross Functional Flowchart
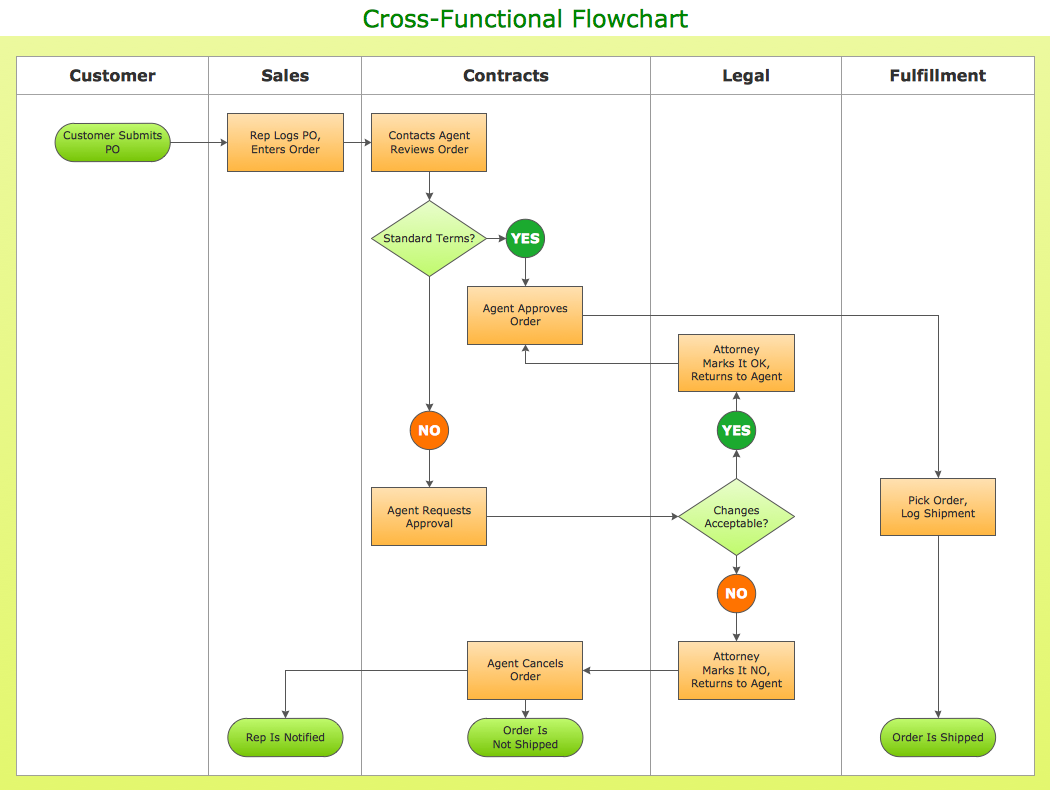
ConceptDraw PRO is a powerful tool that helps you create professional looking cross-functional flowcharts with the well-designed objects. ConceptDraw PRO - Drawing Software for Vertical Cross Functional Flowchart. ConceptDraw allows you to focus on work, not the drawing process. ConceptDraw Arrows10 Technology allows to draw connectors with smart behavior that gives flexibility to you during work process.Cross Functional Flowchart Shapes
When you are drawing a cross-functional flowchart with ConceptDraw Arrows10 Technology - you get it easily and fast. ConceptDraw Template library has more than enough versatility to draw any type of diagram with any degree of complexity. You will get a cross-functional flowchart with basic shapes which can be drawn in minutes, as the result.- How to Draw an Organization Chart | Organizational Structure ...
- Prepare Organization Chart Of Any Establishment Of Your Choice
- Mind Map How To Prepare Organisation Chart
- How to Draw an Organization Chart | Examples of Flowcharts, Org ...
- Mind Map How To Build An Organizational Chart
- Process Flowchart | Organizational Structure | Flow Chart Symbols ...
- Draw Organisation Structure Of Your Business
- Prepare Organisation Chartes Of Any Establishment Of Your Choice
- Draw And Explain Any Organizational Chart Or Institution Of Your
- How To Prepare A Organisation Chart For Office
- Draw An Organizational Chart Illustrate Individual Organisation
- How to Draw an Organization Chart | ConceptDraw PRO ...
- Prepare Organisational Chart Of Any Established Of Our Choice
- Www Draw An Organizational Chart Of Health Sector
- Seating Plans | AWS Architecture Diagrams | How to Draw an ...
- Draw An Organizational Chart To Illustrate Individual And
- How to Create Organizational Chart Quickly | Org Chart Diagram ...
- Functional Organizational Structure | Matrix Organization Structure ...
- How to Create Organizational Chart Quickly | How to Draw an ...
- Organizational Structure Of The Business Of Your Choice


