In marketing perceptual or positioning maps are used for developing the market positioning strategy for product or service.
"Perceptual mapping is a diagrammatic technique used by asset marketers that attempts to visually display the perceptions of customers or potential customers. Typically the position of a product, product line, brand, or company is displayed relative to their competition." [Perceptual mapping. Wikipedia]
This positioning map diagram example was created using the ConceptDraw PRO diagramming and vector drawing software extended with the Matrices solution from the Marketing area of ConceptDraw Solution Park.
 Marketing
This solution extends ConceptDraw PRO v9 and ConceptDraw MINDMAP v7 with Marketing Diagrams and Mind Maps (brainstorming, preparing and holding meetings and presentations, sales calls).
HelpDesk
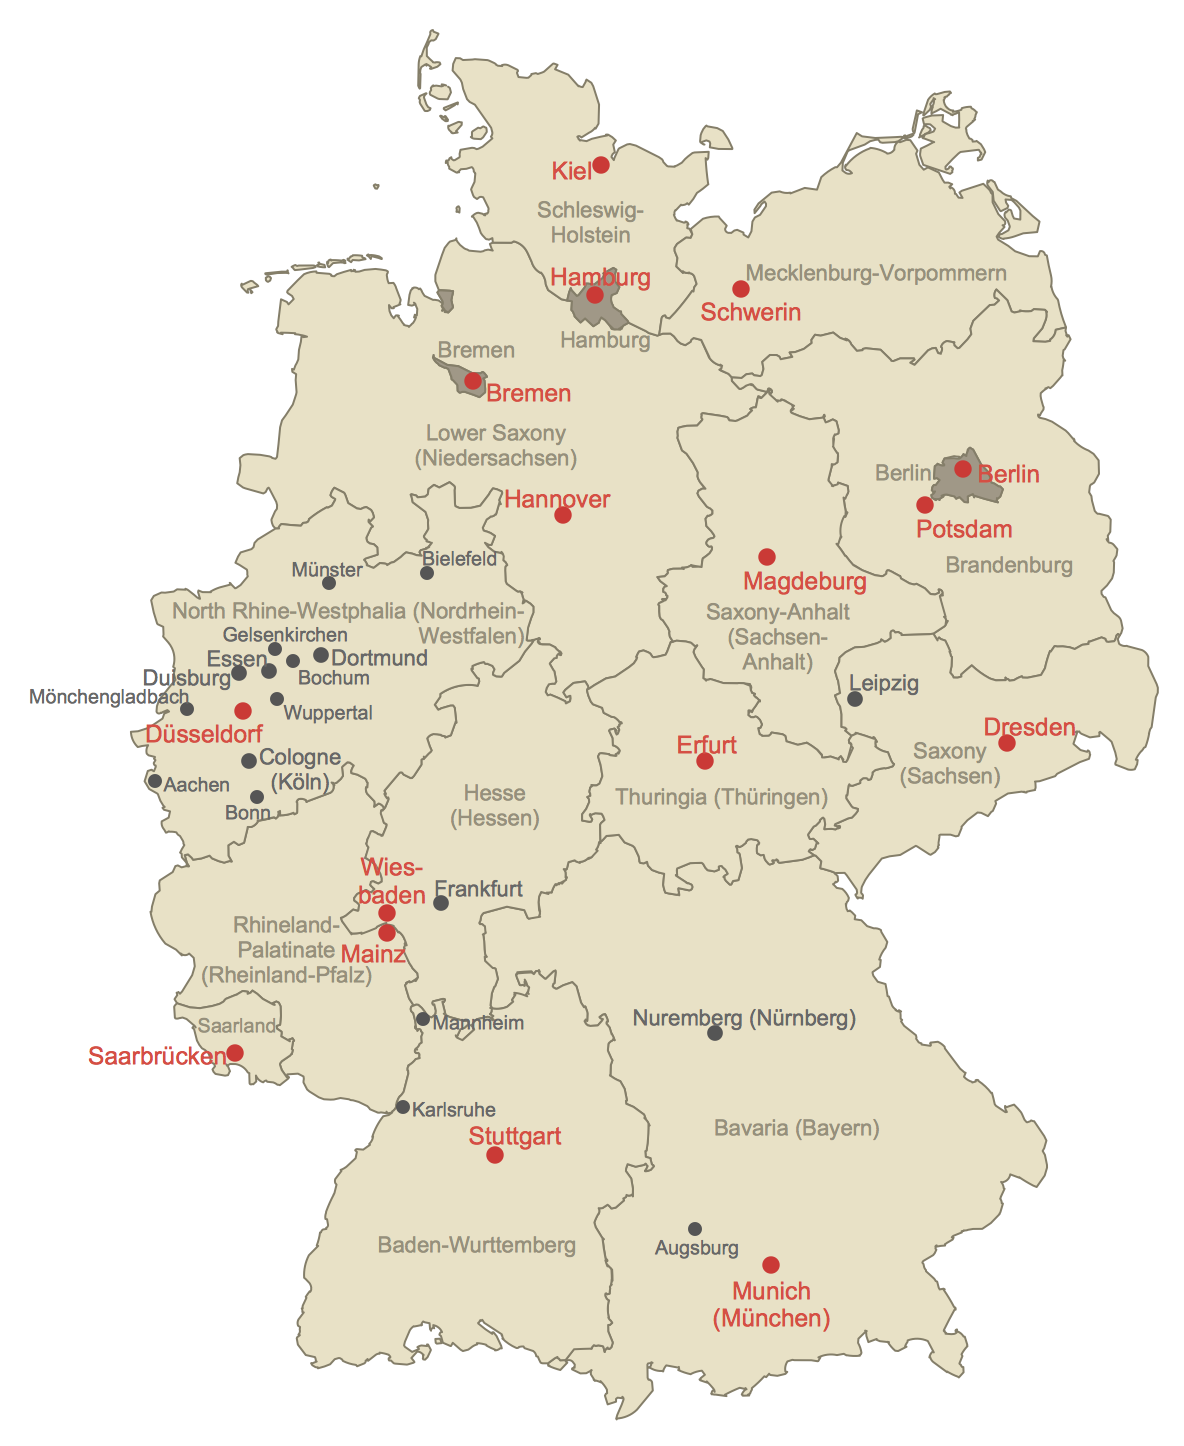
How to Create a Map of Germany Using ConceptDraw PRO
Geographical thematic maps are used to display information on a variety of subjects. It is a common way of representing any form of spatial data in relation to a specific geographical area. The Germany Map Solution for ConceptDraw PRO includes all of the German federal states with county outlined borders and major cities. You can quickly create geographic maps, cartograms, and thematic maps for geographical visualization information for business and travels.Cross Functional Flowchart for Business Process Mapping
Start your business process mapping with conceptDraw PRO and its Arrows10 Technology. Creating a process map, also called a flowchart, is a major component of Six Sigma process management and improvement. Use Cross-Functional Flowchart drawing software for business process mapping (BPM). Use a variety of drawing tools, smart connectors and shape libraries to create flowcharts of complex processes, procedures and information exchange. Define and document basic work and data flows, financial, production and quality management processes to increase efficiency of you business.Gantt charts for planning and scheduling projects
ConceptDraw PROJECT is an excellent simple project scheduling software. It maintain classic project gantt charts and the line of professional reports on resources usage. It include handy critical path scheduling software tools and diagraming tools which helps prepare the presentation of project status. It include project tracking dashboard to keep project metrics upto date, also it have handy feature to export project management dashboard in excel file.- Marketing | Positioning Map | How to Make Soccer Position Diagram ...
- Positioning Map | Positioning map | Business Tools Perceptual ...
- Positioning Map | Infield Positioning for Baseball Situations | SWOT ...
- Positioning Map | SWOT analysis positioning matrix - Template ...
- Positioning map | Positioning Map | Business Tools Perceptual ...
- Marketing | Positioning Map | SWOT analysis matrix diagram ...
- Risk Positioning Diagram | Positioning Map | Infield Positioning for ...
- Positioning map
- Positioning map | Competitor Analysis | Business Tools Perceptual ...
- Competitor Analysis | Positioning map | SWOT Analysis | Brand ...
- Business Tools Perceptual Mapping | BCG Matrix | Soccer (Football ...
- Positioning map | Competitor Analysis | Risk Positioning Diagram ...
- Position Map Of Football
- Foot Ball Position Map
- Business Tools Perceptual Mapping | SWOT analysis matrix ...
- Positioning map | Marketing | Positioning Map | Product Position Map
- Business Tools Perceptual Mapping | Positioning Map | Positioning ...
- Positioning map | Swot Analysis Examples for Mac OSX | What is ...
- Business Tools Perceptual Mapping | Mind Maps for Business ...
- Business Tools Perceptual Mapping | Positioning Map | Mind Maps ...


