HelpDesk
How to Draw a Pie Chart Using ConceptDraw PRO

"Time management is the .. process of planning and exercising conscious control over the amount of time spent on specific activities, especially to increase effectiveness, efficiency or productivity. Time management may be aided by a range of skills, tools, and techniques used to manage time when accomplishing specific tasks, projects, and goals complying with a due date. Initially, time management referred to just business or work activities, but eventually the term broadened to include personal activities as well. A time management system is a designed combination of processes, tools, techniques, and methods. Time management is usually a necessity in any project development as it determines the project completion time and scope." [Time management. Wikipedia]
This timetable pie chart shows the plan of daily actions and its durations in minutes.
It is useful visual tool of personal time management.
This schedule pie chart example was created using the ConceptDraw PRO diagramming and vector drawing software extended with the Target and Circular Diagrams solution from the Marketing area of ConceptDraw Solution Park.
www.conceptdraw.com/ solution-park/ marketing-target-and-circular-diagrams
Daily activities pie chart

Basic Diagramming


"The distribution of wealth is a comparison of the wealth of various members or groups in a society. It differs from the distribution of income in that it looks at the distribution of ownership of the assets in a society, rather than the current income of members of that society." [Distribution of wealth. Wikipedia]
This pie chart sample was redesigned from the Wikimedia Commons file: Percentage of the top 1% wage earners in the United States by occupation (pie chart).svg.
[commons.wikimedia.org/ wiki/ File:Percentage_ of_ the_ top_ 1%25_ wage_ earners_ in_ the_ United_ States_ by_ occupation_ (pie_ chart).svg]
This file is licensed under the Creative Commons Attribution-Share Alike 3.0 Unported license. [creativecommons.org/ licenses/ by-sa/ 3.0/ deed.en]
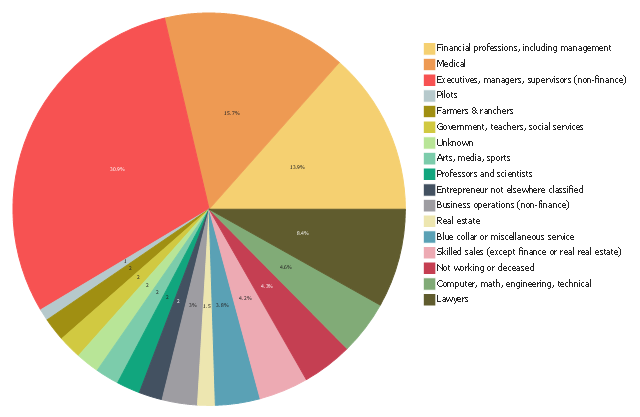
This graph shows the make up of the top one percent of United States wage earners, grouped by occupation. Data for this graph is sourced from the November 2010 report written by Jon Bakija, Adam Cole, and Bradley T. Heim titled "Jobs and Income Growth of Top Earners and the Causes of Changing Income Inequality: Evidence from U.S. Tax Return Data", column "2005" in table 2, titled "Percentage of primary taxpayers in top one percent of the distribution of income (excluding capital gains) that are in each occupation", on page 50.
The pie chart example "Percentage of the top 1% wage earners in the US by occupation" was created using the ConceptDraw PRO diagramming and vector drawing software extended with the Pie Charts solutiton of the Graphs and Charts area in ConceptDraw Solution Park.
This pie chart sample was redesigned from the Wikimedia Commons file: Percentage of the top 1% wage earners in the United States by occupation (pie chart).svg.
[commons.wikimedia.org/ wiki/ File:Percentage_ of_ the_ top_ 1%25_ wage_ earners_ in_ the_ United_ States_ by_ occupation_ (pie_ chart).svg]
This file is licensed under the Creative Commons Attribution-Share Alike 3.0 Unported license. [creativecommons.org/ licenses/ by-sa/ 3.0/ deed.en]
This graph shows the make up of the top one percent of United States wage earners, grouped by occupation. Data for this graph is sourced from the November 2010 report written by Jon Bakija, Adam Cole, and Bradley T. Heim titled "Jobs and Income Growth of Top Earners and the Causes of Changing Income Inequality: Evidence from U.S. Tax Return Data", column "2005" in table 2, titled "Percentage of primary taxpayers in top one percent of the distribution of income (excluding capital gains) that are in each occupation", on page 50.
The pie chart example "Percentage of the top 1% wage earners in the US by occupation" was created using the ConceptDraw PRO diagramming and vector drawing software extended with the Pie Charts solutiton of the Graphs and Charts area in ConceptDraw Solution Park.
Pie chart
 Cooking Recipes
Create quick and easy recipe diagrams with the Cooking Recipes solution. Make a tasty meal for dinner, for holidays, or for a party.
How to Create Presentation of Your Project Gantt Chart

Scatter Graph

 Chemistry
This solution extends ConceptDraw PRO software with samples, template and libraries of vector stencils for drawing the Chemistry Illustrations for science and education.
 Seating Plans
The correct and convenient arrangement of tables, chairs and other furniture in auditoriums, theaters, cinemas, banquet halls, restaurants, and many other premises and buildings which accommodate large quantity of people, has great value and in many cases requires drawing detailed plans. The Seating Plans Solution is specially developed for their easy construction.
 PM Response
This solution extends all ConceptDraw Office 2.0 products by helping to improve the response time to project changes. PM Response also helps with iteration planning, discussing project layout approaches, and solving project challenges.
 School and Training Plans
Planning a school and its campus layout needs to depict the premises, represent internal spaces, location of windows and direction of natural light. Detailed classroom seating chart helps you visualize location of the blackboard and desks, taking into account the specifics of the room and its lighting, with a goal to design the classroom to be comfortable for each pupil and teacher.
- Schedule pie chart - Daily action plan | Pie Table Timetable
- Table Seating Chart Template | How to Draw a Pie Chart Using ...
- Composition Conversion Of Graphics Pie Chart Bar Chart Table
- Hw To Draw Pie Chart To Time Table
- Bar Pie Flow Table Chart With Example Explanation
- A Students Time Table By Pie Chirt
- Table Diagram Pie Chart Of It Software Development
- Time Management Tables And Pie Charts
- Schedule pie chart - Daily action plan | How to Use ConceptDraw ...
- Conversion Of Graphics Pie Chart Table Flow Chart
- Schedule pie chart - Daily action plan | UML sequence diagram ...
- Table Seating Chart Template | Entity Relationship Diagram - ERD ...
- Schedule pie chart - Daily action plan | How to Use ConceptDraw ...
- How to Draw a Pie Chart Using ConceptDraw PRO | Banquet Hall ...
- Images Of Bar Graph Pie Chart Table Graph And Diagram On One ...
- Pie Chart Examples and Templates | Examples of Flowcharts, Org ...
- Free Table Chart Maker
- Writing Definitions Compostion Conversion Of Ghaphics Pie Chart
- Pie Chart Software | Chart Maker for Presentations | How to Draw ...
- Pie Chart Styles