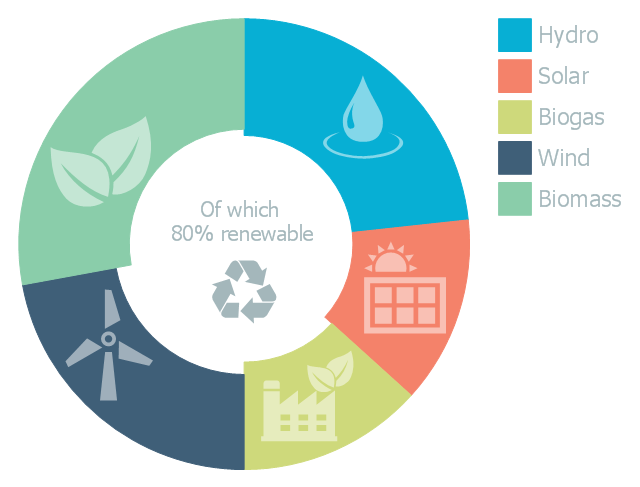
This doughnut chart sample illustrates the renewable energy sources. It was designed on the base of the Wikipedia file: Example of a doughnut chart.png.
[en.wikipedia.org/ wiki/ File:Example_ of_ a_ doughnut_ chart.png]
This file is licensed under the Creative Commons Attribution-ShareAlike 3.0 License. [creativecommons.org/ licenses/ by-sa/ 3.0/ ]
"Renewable energy is generally defined as energy that is collected from resources which are naturally replenished on a human timescale, such as sunlight, wind, rain, tides, waves, and geothermal heat. Renewable energy often provides energy in four important areas: electricity generation, air and water heating/ cooling, transportation, and rural (off-grid) energy services." [Renewable energy. Wikipedia]
The donut chart example "Renewable energy" was created using the ConceptDraw PRO diagramming and vector drawing software extended with the Pie Charts solutiton of the Graphs and Charts area in ConceptDraw Solution Park.
Donut chart
 Pie Charts
Pie Charts are extensively used in statistics and business for explaining data and work results, in mass media for comparison (i.e. to visualize the percentage for the parts of one total), and in many other fields. The Pie Charts solution for ConceptDraw PRO v10 offers powerful drawing tools, varied templates, samples, and a library of vector stencils for simple construction and design of Pie Charts, Donut Chart, and Pie Graph Worksheets.
This cycle diagram sample was created on the base of the figure illustrating the article "Environmental Materials" by Cris Arnold from the website of the UK Centre for Materials Education of the Higher Education Academy. "The figure ... schematically shows how the disparate areas under the heading of 'environmental materials' can be linked via a life cycle analysis approach. ...
Life Cycle Analysis.
Life Cycle Analysis is essentially a method of considering the entire environmental impact, energy and resource usage of a material or product. It is often known as a 'cradle-to-grave' analysis and can encompass the entire lifetime from extraction to end-of-life disposal. Life cycle analysis can be an extremely effective way of linking many different aspects of the environmental impacts of materials usage. ...
Materials Extraction and Resource Implications.
The environmental impact of raw materials extraction and processing together with global resource issues provides a good place to start consideration of environmental aspects of materials. ...
Environmental Impacts of Processing.
... Topics that would come under this subject area include the specific environmental problems associated with processing of metals, polymers, ceramics, composites etc, and how these problems can be overcome.
Design for Sustainability.
This area ... will ... cover issues such as design for successful recycling, waste minimisation, energy efficiency and increased lifetime.
Economic, Social and Legislative Issues.
... For example, materials selection within the automotive industry is now heavily influenced by 'end-of-life vehicle' and 'hazardous material' regulations.
Use of Sustainable Materials.
... It is probably sensible to define such materials as those that have distinct differences that achieve environmental benefit compared to conventional materials. With this definition, the list would include:
(1) Materials of a significantly plant-based nature, including wood, natural fibre composites, natural polymers.
(2) Materials produced using a large proportion of waste material, including recycled polymers, composites made from waste mineral powders, and arguably also much steel and aluminium.
Materials for Green Energy.
The most exciting developments in Materials Science are in the realm of functional materials, and many of these serve an environmentally-beneficial purpose, particularly in the production of green energy.
These include:
(1) Solar-cell materials.
(2) Fuel-cell technology.
(3) Catalytic pollution control.
End-of-Life Issues.
The treatment of materials at the end of their lifetime is a significant subject area and encompasses aspects such as recycling techniques and materials limitations, biodegradabilty and composting, chemical recovery and energy recovery." [materials.ac.uk/ guides/ environmental.asp]
The ring chart example "Life cycle analysis" was created using the ConceptDraw PRO diagramming and vector drawing software extended with the Target and Circular Diagrams solution from the Marketing area of ConceptDraw Solution Park.
www.conceptdraw.com/ solution-park/ marketing-target-and-circular-diagrams
Ring chart

 Divided Bar Diagrams
The Divided Bar Diagrams Solution extends the capabilities of ConceptDraw PRO v10 with templates, samples, and a library of vector stencils for drawing high impact and professional Divided Bar Diagrams and Graphs, Bar Diagram Math, and Stacked Graph.
"Consumption of energy resources, (e.g. turning on a light) requires resources and has an effect on the environment. Many electric power plants burn coal, oil or natural gas in order to generate electricity for energy needs. While burning these fossil fuels produces a readily available and instantaneous supply of electricity, it also generates air pollutants including carbon dioxide (CO2), sulfur dioxide and trioxide (SOx) and nitrogen oxides (NOx). Carbon dioxide is an important greenhouse gas which is thought to be responsible for some fraction of the rapid increase in global warming seen especially in the temperature records in the 20th century, as compared with tens of thousands of years worth of temperature records which can be read from ice cores taken in Arctic regions. Burning fossil fuels for electricity generation also releases trace metals such as beryllium, cadmium, chromium, copper, manganese, mercury, nickel, and silver into the environment, which also act as pollutants.
The large-scale use of renewable energy technologies would "greatly mitigate or eliminate a wide range of environmental and human health impacts of energy use". Renewable energy technologies include biofuels, solar heating and cooling, hydroelectric power, solar power, and wind power. Energy conservation and the efficient use of energy would also help." [Energy industry. Environmental impact. Wikipedia]
The Energy resources diagram example was created in the ConceptDraw PRO diagramming and vector drawing software using the Manufacturing and Maintenance solution from the Illustration area of ConceptDraw Solution Park.
Infographics

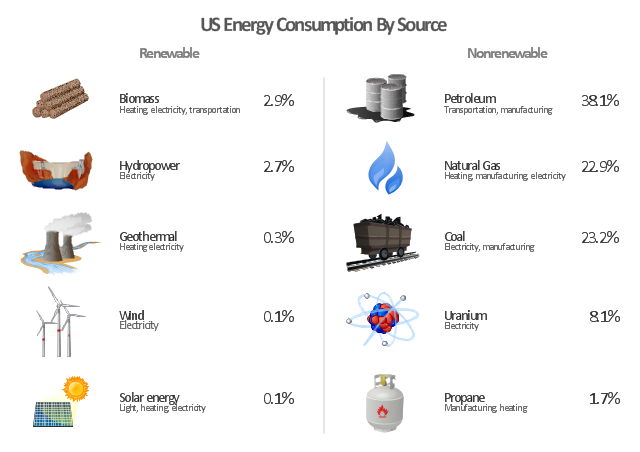
"The United States is the 800th largest energy consumer in terms of total use in 2010. ...
The majority of this energy is derived from fossil fuels: in 2010, data showed 25% of the nation's energy came from petroleum, 22% from coal, and 22% from natural gas. Nuclear power supplied 8.4% and renewable energy supplied 8%, which was mainly from hydroelectric dams although other renewables are included such as wind power, geothermal and solar energy." [Energy in the United States. Wikipedia]
The infographics example "U.S. energy consumption by source" was created in the ConceptDraw PRO diagramming and vector drawing software using the Manufacturing and Maintenance solution from the Illustration area of ConceptDraw Solution Park.
Infographics
Flow chart Example. Warehouse Flowchart


3 Ways to Quickly Create Excellent Presentations

- Pie Chart For Solar Energy
- Pie Charts | Divided Bar Diagrams | Energy resources diagram ...
- Energy resources diagram | Divided Bar Diagrams | Pie Charts ...
- Prepare Chart Showing The Flow Of Solar Energy
- Divided Bar Diagrams | Pie Charts | Renewable Energy Visio Stencil
- Types of Flowcharts | Energy resources diagram | Pie Charts | Solar ...
- Energy resources diagram | Pie Charts | U.S. energy consumption ...
- Block Diagram Of Solar Energy
- Energy resources diagram | Solar Energy Conservation Chart
- Pie Charts | Manufacturing and Maintenance | Divided Bar Diagrams ...