This site uses cookies. By continuing to browse the ConceptDraw site you are agreeing to our Use of Site Cookies.

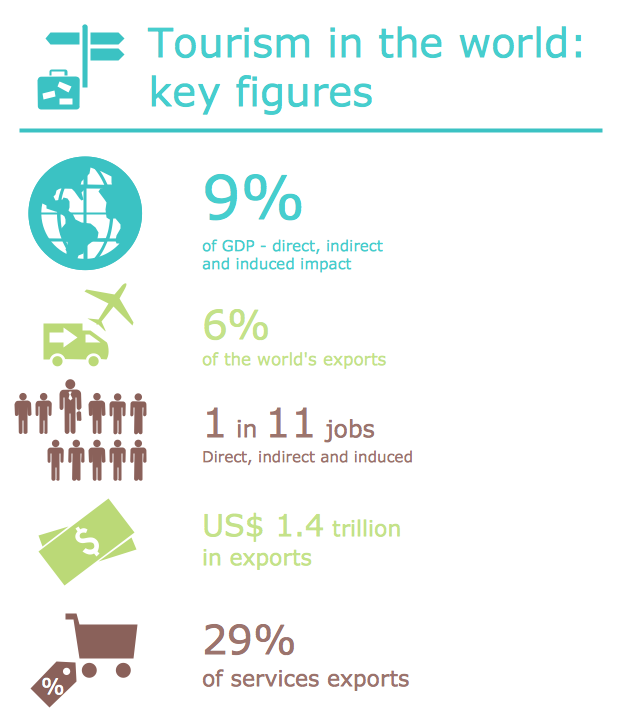
Sample Pictorial Chart. Sample Infographics

Sample Pictorial Chart - Pictorial Infographics solution provides easy-to-use design infographics drawing tools, large collection of different sample infographics and infograms, sample pictorial chart and templates to be filled in, and 10 libraries with great quantity of predesigned vector pictograms. Use Pictorial Infographics solution to draw your own design pictorial infographics documents quick and easy.
HelpDesk

How to Draw a Pictorial Chart

Pictorial Infographics is used to visually present data comparison. Pictorial charts use relative sizes or repetitions of the same icon, picture, or symbol to show data relation. Using a Pictorial chart to show business data patterns and trends will add much more efficiency to your business communications. Finding the right tool for the job can sometimes be tricky. Developing sophisticated and effective infographics can require toolsthat may span many different products. Fortunately, ConceptDraw DIAGRAM has everything you need to create polished Pictorial Infographics that beautifully and accurately represent your story, no matter how complex it may be.

draw picture graph, draw picture chart, image chart, pictorial chart Picture Graphs

draw picture graph, draw picture chart, image chart, pictorial chart
Typically, a Picture Graph has very broad usage. They many times used successfully in marketing, management, and manufacturing. The Picture Graphs Solution extends the capabilities of ConceptDraw DIAGRAM with templates, samples, and a library of professionally developed vector stencils for designing Picture Graphs.

Scatter Graph Charting Software

ConceptDraw provides some interactive xy chart and scatter graph symbols that offers advanced features yet is simple to use.
HelpDesk

How to Create a Picture Graph

Picture Graphs are used commonly to represent non-complex data to a large audience. A Picture Graph is simple kind of marketing diagram used to show the relationship among various quantities. It include pictures or symbols to represent information visually. There are many cases when you have just some numbers to show and compare. This is not a reason to not use visual tools. You can produce a simple picture graph using memorable symbols to get the best visual presentation. Using specific symbols instead of regular colored bars makes picture graphs a much more descriptive tool. You can use tools from an existing library or find appropriate clipart in ConceptDraw’s collection. ConceptDraw DIAGRAM allows you to draw a simple and easy to understand Graph Charts using the special library.

Business Report Pie. Pie Chart Examples

This sample shows the Business Report Pie Chart. The Pie Chart visualizes the data as the proportional parts of a whole, illustrates the numerical proportion. Pie Charts are very useful in the business, statistics, analytics, mass media.

Pictorial Chart

You want design Pictorial Chart or Infographic? And you need powerful infographic software? Then ConceptDraw DIAGRAM diagramming and vector drawing software extended with Pictorial Infographics Solution from the “Infographics” Area is exactly what you need.

Pictures of Graphs

ConceptDraw DIAGRAM diagramming and vector drawing software extended with Picture Graphs solution from the Graphs and Charts Area is the best choice for making professional looking pictures of graphs and colorful picture graphs.

Basic Picture Graphs, image chart, pictorial chart Basic Picture Graphs

Basic Picture Graphs, image chart, pictorial chart
This solution extends the capabilities of ConceptDraw DIAGRAM (or later) with templates, samples and a library of vector stencils for drawing Picture Graphs.