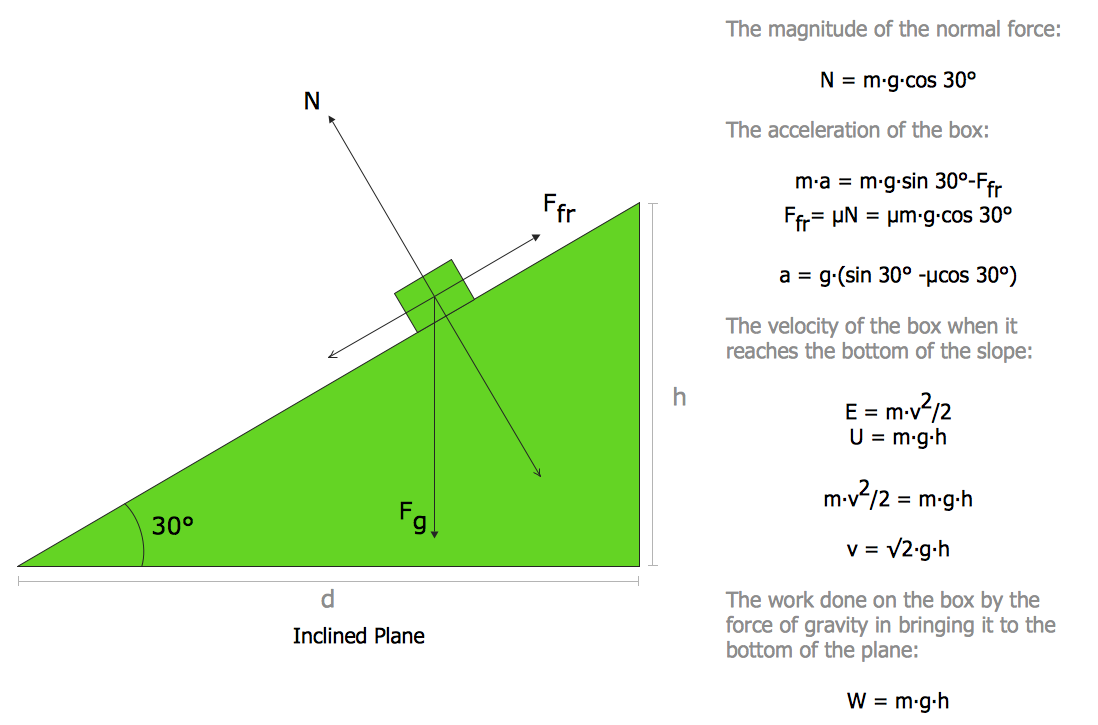
Physics Symbols

Physics Diagrams
Process Flow Chart Symbols

Tables’ Beauty
Value Stream Mapping Icons
Line Chart Template for Word

 Pharmacy Illustrations
Pharmacy Illustrations solution with improbable quantity of predesigned vector objects and icons of pharmacy symbols, medical and health products, pharmacy images of drugstore products, pharmacy clipart of medication tools, pharmacy logo, and other pharmacy pictures is the best for designing the pharmacy illustrations of varied kinds, pharmacy and medical diagrams and schematics, for making the presentation slides and posters on the medical, pharmacy, pharmacology and pharmaceutical thematics, for designing the illustrative materials about ways of prevention diseases and also treatment them, for creation colorful illustrations helpful in newborn and baby care, the infographics and collages to be presented at the premises of medical establishments and during the lectures at the medical education institutions, also on the billboards and in other advertising materials.
Onion Diagram Process Design

 Active Directory Diagrams
Active Directory Diagrams solution significantly extends the capabilities of ConceptDraw DIAGRAM software with special Active Directory samples, convenient template and libraries of Active Directory vector stencils, common icons of sites and services, icons of LDPA elements, which were developed to help you in planning and modelling network structures and network topologies, in designing excellently looking Active Directory diagrams, Active Directory Structure diagrams, and Active Directory Services diagram, which are perfect way to visualize detailed structures of Microsoft Windows networks, Active Directory Domain topology, Active Directory Site topology, Organizational Units (OU), and Exchange Server organization.
 Computer Network Diagrams
Computer Network Diagrams solution extends ConceptDraw DIAGRAM software with samples, templates and libraries of vector icons and objects of computer network devices and network components to help you create professional-looking Computer Network Diagrams, to plan simple home networks and complex computer network configurations for large buildings, to represent their schemes in a comprehensible graphical view, to document computer networks configurations, to depict the interactions between network's components, the used protocols and topologies, to represent physical and logical network structures, to compare visually different topologies and to depict their combinations, to represent in details the network structure with help of schemes, to study and analyze the network configurations, to communicate effectively to engineers, stakeholders and end-users, to track network working and troubleshoot, if necessary.
- Physics All Symbol Images And Symbol Name Download Pdf File
- Mathametics And Physics Symbol Name
- Physics | Physics Symbol Name Image Download
- Physics Symbols And Name Pdf
- Physics All Farmula Symbol Name
- Physics Symbols | All Symbols Of Physics With Name And Formuls
- Pic Of Symbols Use In Physics With There Name
- Physics Sympol Scietific Name Pdf Download
- Physics Symbols | Scientific Symbols Chart | Biology Symbols ...
- Physics Symbols | Symble Of Physic With Name Images