HelpDesk
How to Create an ERD Diagram
 using Chen's notation")
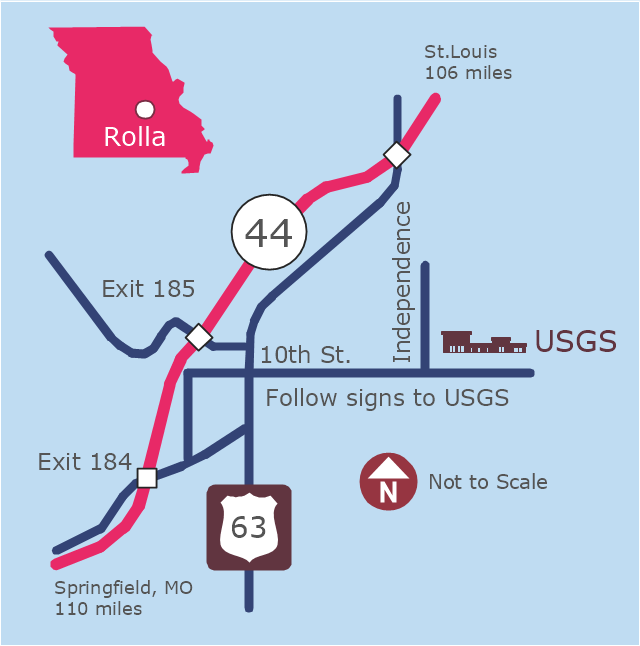
This example was created on the base of the locator map from the website of the Rolla USGS Center. "Rolla USGS Center.
The Rolla USGS is home to the National Geospatial Technical Operations Center, the Missouri Water Science Center, the National Spatial Data Infrastructure Partnership Office Liaisons, and the Rolla Science Information Services office. Employees at this location provide customers with geospatial, geographic, water, biologic and geologic products; science; data; and research, along with offering partnerships and contracting opportunities for local, state, federal, and private entities.
The National Geospatial Technical Operations Center (NGTOC) is a production, research, and data management facility for maps and digital cartographic data products. The work of the NGTOC supports planning and development activities; construction projects; scientific studies; resource management; and environmental monitoring activities, nationwide, at every level of government, academia, and the private sector. The NGTOC in Rolla, along with the other NGTOC site in Denver, plays a key operational role in supporting The National Map, US Topo, The National Atlas™ and all associated products and services, including national coverage of digital orthoimagery, digital elevation data, the National Hydrography Dataset, geographic names, public domain transportation, structures, and governmental units data, and topographic maps. Staff in the Center of Excellence for Geospatial Information Science (CEGIS) are also located in the NGTOC. ... Rolla Missouri Location Map The Rolla USGS Center is located in Rolla, Missouri. Rolla, the county seat of Phelps County, is an attractive mixture of rural and urban life. It is the home of several high-technology businesses and Federal agencies, including the U.S. Geological Survey and the U.S. Forest Service. Missouri University of Science and Technology, a nationally recognized leader in science and technology, has educated students in Rolla for more than 140 years.
Rolla is located at the crossroads of I-44, US 63 and Missouri Highway 72 and is a popular stop on Historic Route 66. Jefferson City, the state capital, is 62 miles to the north, St. Louis lies 106 miles northeast and Springfield is 110 miles southwest." [mcmcweb.er.usgs.gov]
The example "Rolla USGS Center locator map" was created using the ConceptDraw PRO diagramming and vector drawing software extended with the Directional Maps solution from the Maps area of ConceptDraw Solution Park.
Locator map
Is ConceptDraw PRO an Alternative to Microsoft Visio?

- 4 Level pyramid model diagram - Information systems types | 5 Level ...
- Chart Of Management Information System With Diagram
- Operational Level Management Information System
- Information Systems Used At Operational Level
- Operational Level Flowchart
- Element Of Sales And Marketing Data Operational Level Hierarchy
- Operational Systems Flowcharts
- How Flowchart Used In Operational Levels
- Levels Of Managerial Information System
- Flowchart Of Management Information System
- 4 Level pyramid model diagram - Information systems types ...
- How To Draw A Management Information System Diagram
- 4 Level pyramid model diagram - Information systems types ...
- 4 Level pyramid model diagram - Information systems types ...
- Pyramid Diagram | 4 Level pyramid model diagram - Information ...
- Pyramid Diagram | Pyramid Diagram | 4 Level pyramid model ...
- Operational Support System Flowchart
- Business Information System Diagram
- Diagrams Of Level Management