 ConceptDraw Solution Park
ConceptDraw Solution Park collects graphic extensions, examples and learning materials
 Fault Tree Analysis Diagrams
This solution extends ConceptDraw PRO v9.5 or later with templates, fault tree analysis example, samples and a library of vector design elements for drawing FTA diagrams (or negative analytical trees), cause and effect diagrams and fault tree diagrams.
 ConceptDraw Solution Park
ConceptDraw Solution Park collects graphic extensions, examples and learning materials
 ConceptDraw Solution Park
ConceptDraw Solution Park collects graphic extensions, examples and learning materials
HelpDesk
How to Create a Timeline Diagram in ConceptDraw PRO
A Timeline is a chart which displays a project plan schedule in chronological order. A Timeline is used in project management to depict project milestones and visualize project phases, and show project progress. The graphic form of a timeline makes it easy to understand critical project milestones, such as the progress of a project schedule. Timelines are particularly useful for project scheduling or project management when accompanied with a Gantt chart. It captures the main of what the project will accomplish and how it will be done. making a project timeline is one of the most important skills a project manager needs have. Making comprehensive, accurate timelines allows you getting every project off in the best way. ConceptDraw PRO allows you to draw a timeline charts using special library.
 Cross-Functional Flowcharts
Cross-functional flowcharts are powerful and useful tool for visualizing and analyzing complex business processes which requires involvement of multiple people, teams or even departments. They let clearly represent a sequence of the process steps, the order of operations, relationships between processes and responsible functional units (such as departments or positions).
HelpDesk
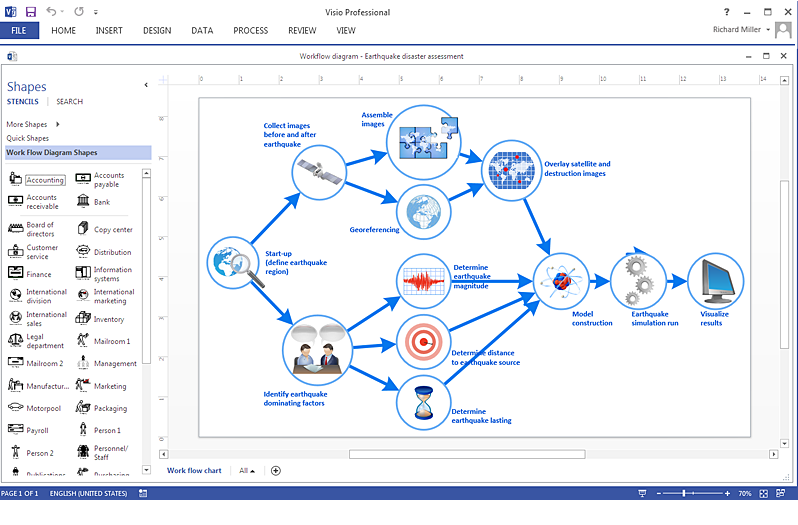
How To Create a MS Visio Workflow Diagram Using ConceptDraw PRO
A workflow diagram shows a working process as a set of related events that follow each other in a particular order.They are usually created as flowcharts, with shapes that represent steps in the process connected by arrows that indicate the next step. Making a business process diagram involves many elements that can be managed using ConceptDraw PRO. The ability to design workflow diagrams is delivered by the Workflow Diagrams solution. ConceptDraw PRO allows you to easily create workflow diagrams and then make a MS Visio file from your diagrams. Using ConceptDraw PRO, you can export your workflow diagrams to MS Visio VSDX and VDX files.- State Diagram Example - Online Store | UML Component Diagram ...
- Flow Chart Online | Online Flow Chart | Cross-Functional Flowcharts ...
- Create Flowcharts Online
- Visio Network Diagram Storage
- Create Idef0 Diagrams Online
- UML Component Diagram Example - Online Shopping | UML ...
- Data Flow Diagrams | Process Flowchart | Visio Files and ...
- Process Flowchart | Flowchart Definition | Types of Flowcharts ...
- UML Component Diagram Example - Online Shopping | UML Tool ...
- Data Flow Diagram
- Online Software Draw Block Diagrams
- ConceptDraw Solution Park | Fishbone Diagram | PM Personal Time ...
- Example of DFD for Online Store (Data Flow Diagram ) DFD ...
- UML Collaboration Diagram (UML2.0) | Online Diagram Tool | UML ...
- Required Flowcharts For Online Purchasing
- Data Flow Diagrams (DFD) | State Diagram Example - Online Store ...
- Online store social media response flowchart | Types of Flowcharts ...
- Process Flowchart | Example of DFD for Online Store (Data Flow ...
- Free Online Workflow Diagram
- Visio Substitute Online

