 ConceptDraw Solution Park
ConceptDraw Solution Park collects graphic extensions, examples and learning materials
 25 Typical Orgcharts
The 25 Typical Orgcharts solution contains powerful organizational structure and organizational management drawing tools, a variety of professionally designed organization chart and matrix organization structure samples, 25 templates based on various orga
HelpDesk
How to Connect Text Data to a Time Series Chart on Your Live Dashboard


HelpDesk
How to Create a Sales Dashboard Using ConceptDraw PRO

ConceptDraw Solution Park
ConceptDraw Solution Park collects graphic extensions, examples and learning materials
ConceptDraw Solution Park
ConceptDraw Solution Park collects graphic extensions, examples and learning materials
 Computer and Networks Area
The solutions from Computer and Networks Area of ConceptDraw Solution Park collect samples, templates and vector stencils libraries for drawing computer and network diagrams, schemes and technical drawings.
HelpDesk
How to Connect a Live Object to a Text Data Source


 Fault Tree Analysis Diagrams
This solution extends ConceptDraw PRO v9.5 or later with templates, fault tree analysis example, samples and a library of vector design elements for drawing FTA diagrams (or negative analytical trees), cause and effect diagrams and fault tree diagrams.
HelpDesk
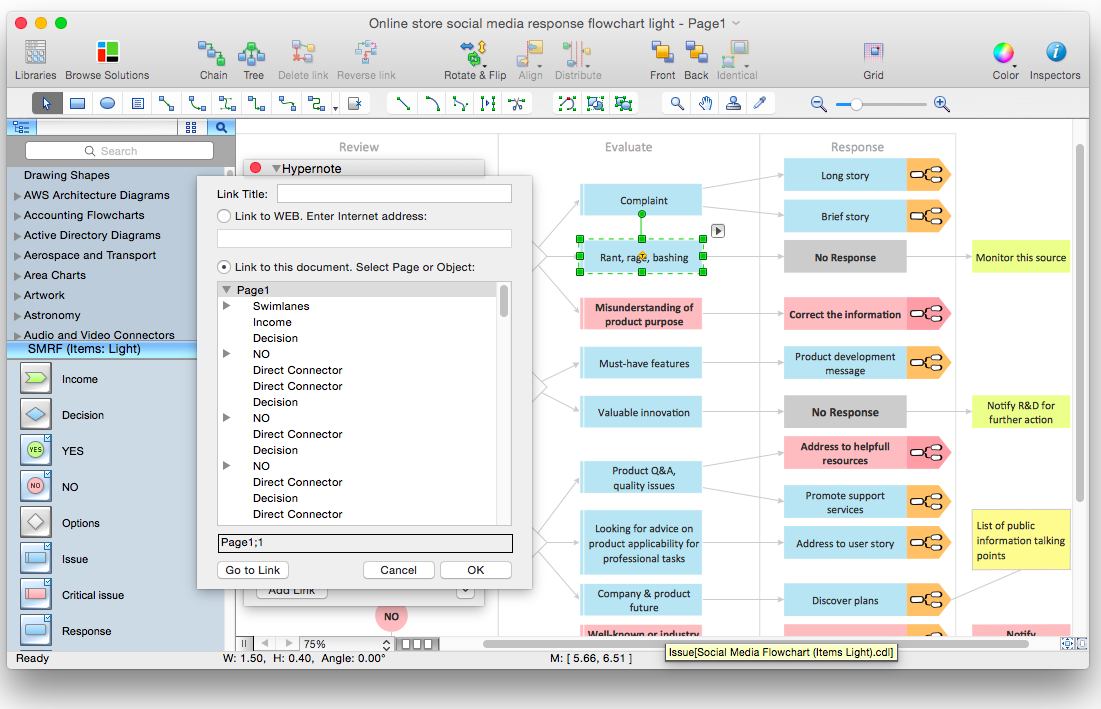
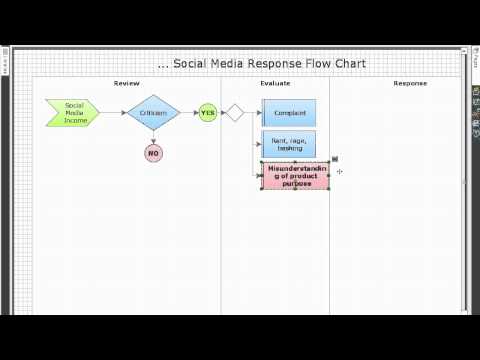
How to Organize a Social Media Activity Using Social Media Response Solution
 PM Planning
This solution extends ConceptDraw MINDMAP and ConceptDraw Project software, allowing you to automatically create documents that reflect a project's status, for people who have different project roles.
HelpDesk
How to Create Education Infographics

 Sales Flowcharts
The Sales Flowcharts solution lets you create and display sales process maps, sales process workflows, sales steps, the sales process, and anything else involving sales process management.
- Online Organisation Chart
- Social Media Response | What is Interactive Flowcharts | How to ...
- Online Org Charts
- Interactive Organizational Chart
- Online Organization Chart
- Organisation Chart Online
- Create An Organizational Chart Online Free
- Organisational Chart Online
- Examples of Flowcharts, Org Charts and More | How to Connect Text ...
- Flow Chart Online | Online Flow Chart | ConceptDraw Solution Park ...
- Interactive Org Chart
- Flow chart Example. Warehouse Flowchart | Process Flowchart ...
- Create Organization Chart Online
- Marketing Sales Flow Chart
- Horizontal Orgchart | ConceptDraw PRO - Organizational chart ...
- What is Interactive Flowcharts | Create Response Charts | How to ...
- Flow Chart Online | Online Flow Chart | Program Evaluation and ...
- Examples of Flowcharts, Org Charts and More | Program Evaluation ...
- How To Create a PERT Chart | Flow Chart Online | How to Draw the ...
- How to Draw an Organizational Chart with ConceptDraw PRO | How ...