This vector stencils library contains 195 cloud computing icons.
Use it to design cloud computing infographic and diagrams with ConceptDraw PRO software.
"Cloud computing, also on-demand computing, is a kind of Internet-based computing that provides shared processing resources and data to computers and other devices on demand. It is a model for enabling ubiquitous, on-demand access to a shared pool of configurable computing resources (e.g., networks, servers, storage, applications and services), which can be rapidly provisioned and released with minimal management effort. Cloud computing and storage solutions provide users and enterprises with various capabilities to store and process their data in third-party data centers.
Cloud computing has become a highly demanded service or utility due to the advantages of high computing power, cheap cost of services, high performance, scalability, accessibility as well as availability." [Cloud computing. Wikipedia]
The vector stencils library "Cloud clipart" is included in the Cloud Computing Diagrams solution from the Computer and Networks area of ConceptDraw Solution Park.
Access point

Airport

Alert

Banknote

Banknote bundle

Banknote bundles

Backup

Bar chart

Big data

Book (closed)
-cloud-clipart---vector-stencils-library.png--diagram-flowchart-example.png)
Book (open)
-cloud-clipart---vector-stencils-library.png--diagram-flowchart-example.png)
Books

Box, close

Box, open

Braces

Brackets

Bug

Building

Bus

Cable connection

Calculator

Calendar

Car

CD/DVD

Check list

Check mark

Clock

Cloud

Cloud computing

Cloud database

Cloud hosting

Cloud storage

Code

Coffee cup

Coin

Coins stack

Coins stacks

Communication

Computer terminal

Console

CPU

Credit card

Cubes

Dashboard

Database

Databases

Datacenter

Dialog box

Dialog boxes

Document

Documents

Dollar sign

Download

Earth

Email

Equal sign

Ethernet jack

Ethernet plug

Euro sign

Exclamation mark

Eye

Feed symbol

Feedback

File

Files

Filter

Firewall

Flash drive

Folder

Folders

Gamepad

Gauge

Gear

Gears, 2

Gears, 3

Globe

Hacker

Hard drive

Heart

Heart rhythm

Home

Hosting

Hotel

House

Image

Info

IP phone

Jet

Key

Keyboard

Laptop

Lego

Letter

Light bulb

Lightning

Line chart

Linux penguin

List

Load balancer

Location mark

Lock, close

Lock, open

Lock and key

Log

Login

Logout

Magnifying glass

Mail

Map

Memory (RAM)
-cloud-clipart---vector-stencils-library.png--diagram-flowchart-example.png)
Microphone

Minus sign

Mobile phone

Monitor

Mouse

Movie

Music

Music player

Network

Network bus

Newspaper

NIC (Network interface controller)
-cloud-clipart---vector-stencils-library.png--diagram-flowchart-example.png)
Not found (Error 404)
-cloud-clipart---vector-stencils-library.png--diagram-flowchart-example.png)
Notebook

Office printer

Operator

Page

Pages

PC

Pencil

Photo

Photo camera

Pie chart

Platform

Plus sign

Pound sign

Printer

Puzzle

Puzzles, 2x2

Puzzles, 3x3

Question sign

Rackmount server

Router

Safe

Satellite

Satellite antenna

Schedule

Sensor

Server

Server rack

Shield

Ship

Shopping bag

Shopping basket

Shopping cart

Sign up

Smartphone

Social network

Software box

Sound

Spider

Spreadsheet

SSD

Star

Stars, 5

Stethoscope

Stickman

Stickmen

Suitcase

Support

Switch

Syringe

Tablet computer

Tools

Train

Truck

Truck 2

TV

Umbrella

Upload

User man

User woman

User profile

Video

Video camera

Video mail

Virtual disk

Virus

Wallet

Web camera

Wifi antenna

Wireless

Wrench

X cross symbol

Yen sign

This vector stencils library contains 195 cloud computing icons.
Use it to design cloud computing infographic and diagrams with ConceptDraw PRO software.
"Cloud computing, also on-demand computing, is a kind of Internet-based computing that provides shared processing resources and data to computers and other devices on demand. It is a model for enabling ubiquitous, on-demand access to a shared pool of configurable computing resources (e.g., networks, servers, storage, applications and services), which can be rapidly provisioned and released with minimal management effort. Cloud computing and storage solutions provide users and enterprises with various capabilities to store and process their data in third-party data centers.
Cloud computing has become a highly demanded service or utility due to the advantages of high computing power, cheap cost of services, high performance, scalability, accessibility as well as availability." [Cloud computing. Wikipedia]
The vector stencils library "Cloud clipart" is included in the Cloud Computing Diagrams solution from the Computer and Networks area of ConceptDraw Solution Park.
Use it to design cloud computing infographic and diagrams with ConceptDraw PRO software.
"Cloud computing, also on-demand computing, is a kind of Internet-based computing that provides shared processing resources and data to computers and other devices on demand. It is a model for enabling ubiquitous, on-demand access to a shared pool of configurable computing resources (e.g., networks, servers, storage, applications and services), which can be rapidly provisioned and released with minimal management effort. Cloud computing and storage solutions provide users and enterprises with various capabilities to store and process their data in third-party data centers.
Cloud computing has become a highly demanded service or utility due to the advantages of high computing power, cheap cost of services, high performance, scalability, accessibility as well as availability." [Cloud computing. Wikipedia]
The vector stencils library "Cloud clipart" is included in the Cloud Computing Diagrams solution from the Computer and Networks area of ConceptDraw Solution Park.
Access point
Airport
Alert
Banknote
Banknote bundle
Banknote bundles
Backup
Bar chart
Big data
Book (closed)
Book (open)
Books
Box, close
Box, open
Braces
Brackets
Bug
Building
Bus
Cable connection
Calculator
Calendar
Car
CD/DVD
Check list
Check mark
Clock
Cloud
Cloud computing
Cloud database
Cloud hosting
Cloud storage
Code
Coffee cup
Coin
Coins stack
Coins stacks
Communication
Computer terminal
Console
CPU
Credit card
Cubes
Dashboard
Database
Databases
Datacenter
Dialog box
Dialog boxes
Document
Documents
Dollar sign
Download
Earth
Email
Equal sign
Ethernet jack
Ethernet plug
Euro sign
Exclamation mark
Eye
Feed symbol
Feedback
File
Files
Filter
Firewall
Flash drive
Folder
Folders
Gamepad
Gauge
Gear
Gears, 2
Gears, 3
Globe
Hacker
Hard drive
Heart
Heart rhythm
Home
Hosting
Hotel
House
Image
Info
IP phone
Jet
Key
Keyboard
Laptop
Lego
Letter
Light bulb
Lightning
Line chart
Linux penguin
List
Load balancer
Location mark
Lock, close
Lock, open
Lock and key
Log
Login
Logout
Magnifying glass
Mail
Map
Memory (RAM)
Microphone
Minus sign
Mobile phone
Monitor
Mouse
Movie
Music
Music player
Network
Network bus
Newspaper
NIC (Network interface controller)
Not found (Error 404)
Notebook
Office printer
Operator
Page
Pages
PC
Pencil
Photo
Photo camera
Pie chart
Platform
Plus sign
Pound sign
Printer
Puzzle
Puzzles, 2x2
Puzzles, 3x3
Question sign
Rackmount server
Router
Safe
Satellite
Satellite antenna
Schedule
Sensor
Server
Server rack
Shield
Ship
Shopping bag
Shopping basket
Shopping cart
Sign up
Smartphone
Social network
Software box
Sound
Spider
Spreadsheet
SSD
Star
Stars, 5
Stethoscope
Stickman
Stickmen
Suitcase
Support
Switch
Syringe
Tablet computer
Tools
Train
Truck
Truck 2
TV
Umbrella
Upload
User man
User woman
User profile
Video
Video camera
Video mail
Virtual disk
Virus
Wallet
Web camera
Wifi antenna
Wireless
Wrench
X cross symbol
Yen sign
Office - Design Elements

The vector stencils library "Education pictograms" contains 128 education pictograms. Use this flat icon set to design your educational infogram in ConceptDraw PRO diagramming and vector drawing software.
The vector stencils library "Education pictograms" is included in the Education Infographics solution from the Business Infographics area of ConceptDraw Solution Park.
The vector stencils library "Education pictograms" is included in the Education Infographics solution from the Business Infographics area of ConceptDraw Solution Park.
ABC

Apple

Artist oil colors

Artists paint palette
Atom

Baseball
Basketball

Beaker

Bell

Bicycle

Book - open

Books

Brushes

Bunsen burner

Calculator

Calendar

CD

Cell model

Chemical flask

Cloud

Colored paper
Colored pencils

Compass

Compasses

Dinosaur skeleton

Diploma

DNA double helix

Drop

Dumbbells

Earth

Earth's internal structure

Easel

Email

Eraser
Exercise book

Felt tip pens

Folders

Football

Funnel

Gears

Globe

Gouache

Graduation cap

Grand piano

Grand piano - clipart

Green blackboard

Hourglass

Laptop

Laptop mouse

Light bulb

Magnet

Magnifier

Marker - black

Marker - blue

Marker - green

Marker - red

Marker - white

Marker - yellow

Medal with ribbon

Metronome

Microscope

Moon

Music notes

Notebook

Notepad

Paper clips

Paper sheet

Paper sheet - grid
Paper sheet - lined

Paper stickers

Parthenon

Pen

Pen - fountain

Pencil

Periodic table
Protractor

Push pins

Robot

Round bottom flask

Rugby ball

Ruler

Scales

School backpack

School bus

School satchel

Schoolboy - african

Schoolboy - asian

Schoolboy - caucasian

Schoolboy - indian

Schoolgirl - african

Schoolgirl - asian

Schoolgirl - caucasian

Schoolgirl - indian

Scissors and a bottle of glue

Scroll

Snowflake

Sport cup

Star

Stickers
Stopwatch

Sun

Tablet computer

Teacher with a pointer

Teacher - african

Teacher - asian

Teacher - caucasian

Teacher - indian

Teacher - woman, african

Teacher - woman, asian

Teacher - woman, caucasian

Teacher - woman, indian

Telescope

Test tube

Thermometer

To-Do list

Tree leaf - acacia

Tree leaf - birch

Tree leaf - chestnut

Tree leaf - maple

Tree leaf - oak

Tree leaf - walnut

Triangle ruler
Volleyball

Violin
Violin - clipart

Wall clock

Watercolor set
World map

This vector stencils library contains 195 cloud computing icons.
Use it to design cloud computing infographic and diagrams with ConceptDraw PRO software.
"Cloud computing, also on-demand computing, is a kind of Internet-based computing that provides shared processing resources and data to computers and other devices on demand. It is a model for enabling ubiquitous, on-demand access to a shared pool of configurable computing resources (e.g., networks, servers, storage, applications and services), which can be rapidly provisioned and released with minimal management effort. Cloud computing and storage solutions provide users and enterprises with various capabilities to store and process their data in third-party data centers.
Cloud computing has become a highly demanded service or utility due to the advantages of high computing power, cheap cost of services, high performance, scalability, accessibility as well as availability." [Cloud computing. Wikipedia]
The vector stencils library "Cloud clipart" is included in the Cloud Computing Diagrams solution from the Computer and Networks area of ConceptDraw Solution Park.
Use it to design cloud computing infographic and diagrams with ConceptDraw PRO software.
"Cloud computing, also on-demand computing, is a kind of Internet-based computing that provides shared processing resources and data to computers and other devices on demand. It is a model for enabling ubiquitous, on-demand access to a shared pool of configurable computing resources (e.g., networks, servers, storage, applications and services), which can be rapidly provisioned and released with minimal management effort. Cloud computing and storage solutions provide users and enterprises with various capabilities to store and process their data in third-party data centers.
Cloud computing has become a highly demanded service or utility due to the advantages of high computing power, cheap cost of services, high performance, scalability, accessibility as well as availability." [Cloud computing. Wikipedia]
The vector stencils library "Cloud clipart" is included in the Cloud Computing Diagrams solution from the Computer and Networks area of ConceptDraw Solution Park.
Access point
Airport
Alert
Banknote
Banknote bundle
Banknote bundles
Backup
Bar chart
Big data
Book (closed)
Book (open)
Books
Box, close
Box, open
Braces
Brackets
Bug
Building
Bus
Cable connection
Calculator
Calendar
Car
CD/DVD
Check list
Check mark
Clock
Cloud
Cloud computing
Cloud database
Cloud hosting
Cloud storage
Code
Coffee cup
Coin
Coins stack
Coins stacks
Communication
Computer terminal
Console
CPU
Credit card
Cubes
Dashboard
Database
Databases
Datacenter
Dialog box
Dialog boxes
Document
Documents
Dollar sign
Download
Earth
Email
Equal sign
Ethernet jack
Ethernet plug
Euro sign
Exclamation mark
Eye
Feed symbol
Feedback
File
Files
Filter
Firewall
Flash drive
Folder
Folders
Gamepad
Gauge
Gear
Gears, 2
Gears, 3
Globe
Hacker
Hard drive
Heart
Heart rhythm
Home
Hosting
Hotel
House
Image
Info
IP phone
Jet
Key
Keyboard
Laptop
Lego
Letter
Light bulb
Lightning
Line chart
Linux penguin
List
Load balancer
Location mark
Lock, close
Lock, open
Lock and key
Log
Login
Logout
Magnifying glass
Mail
Map
Memory (RAM)
Microphone
Minus sign
Mobile phone
Monitor
Mouse
Movie
Music
Music player
Network
Network bus
Newspaper
NIC (Network interface controller)
Not found (Error 404)
Notebook
Office printer
Operator
Page
Pages
PC
Pencil
Photo
Photo camera
Pie chart
Platform
Plus sign
Pound sign
Printer
Puzzle
Puzzles, 2x2
Puzzles, 3x3
Question sign
Rackmount server
Router
Safe
Satellite
Satellite antenna
Schedule
Sensor
Server
Server rack
Shield
Ship
Shopping bag
Shopping basket
Shopping cart
Sign up
Smartphone
Social network
Software box
Sound
Spider
Spreadsheet
SSD
Star
Stars, 5
Stethoscope
Stickman
Stickmen
Suitcase
Support
Switch
Syringe
Tablet computer
Tools
Train
Truck
Truck 2
TV
Umbrella
Upload
User man
User woman
User profile
Video
Video camera
Video mail
Virtual disk
Virus
Wallet
Web camera
Wifi antenna
Wireless
Wrench
X cross symbol
Yen sign
The vector stencils library "Education pictograms" contains 128 education pictograms. Use this flat icon set to design your educational infogram in ConceptDraw PRO diagramming and vector drawing software.
The vector stencils library "Education pictograms" is included in the Education Infographics solution from the Business Infographics area of ConceptDraw Solution Park.
The vector stencils library "Education pictograms" is included in the Education Infographics solution from the Business Infographics area of ConceptDraw Solution Park.
ABC
Apple
Artist oil colors
Artists paint palette
Atom
Baseball
Basketball
Beaker
Bell
Bicycle
Book - open
Books
Brushes
Bunsen burner
Calculator
Calendar
CD
Cell model
Chemical flask
Cloud
Colored paper
Colored pencils
Compass
Compasses
Dinosaur skeleton
Diploma
DNA double helix
Drop
Dumbbells
Earth
Earth's internal structure
Easel
Email
Eraser
Exercise book
Felt tip pens
Folders
Football
Funnel
Gears
Globe
Gouache
Graduation cap
Grand piano
Grand piano - clipart
Green blackboard
Hourglass
Laptop
Laptop mouse
Light bulb
Magnet
Magnifier
Marker - black
Marker - blue
Marker - green
Marker - red
Marker - white
Marker - yellow
Medal with ribbon
Metronome
Microscope
Moon
Music notes
Notebook
Notepad
Paper clips
Paper sheet
Paper sheet - grid
Paper sheet - lined
Paper stickers
Parthenon
Pen
Pen - fountain
Pencil
Periodic table
Protractor
Push pins
Robot
Round bottom flask
Rugby ball
Ruler
Scales
School backpack
School bus
School satchel
Schoolboy - african
Schoolboy - asian
Schoolboy - caucasian
Schoolboy - indian
Schoolgirl - african
Schoolgirl - asian
Schoolgirl - caucasian
Schoolgirl - indian
Scissors and a bottle of glue
Scroll
Snowflake
Sport cup
Star
Stickers
Stopwatch
Sun
Tablet computer
Teacher with a pointer
Teacher - african
Teacher - asian
Teacher - caucasian
Teacher - indian
Teacher - woman, african
Teacher - woman, asian
Teacher - woman, caucasian
Teacher - woman, indian
Telescope
Test tube
Thermometer
To-Do list
Tree leaf - acacia
Tree leaf - birch
Tree leaf - chestnut
Tree leaf - maple
Tree leaf - oak
Tree leaf - walnut
Triangle ruler
Volleyball
Violin
Violin - clipart
Wall clock
Watercolor set
World map
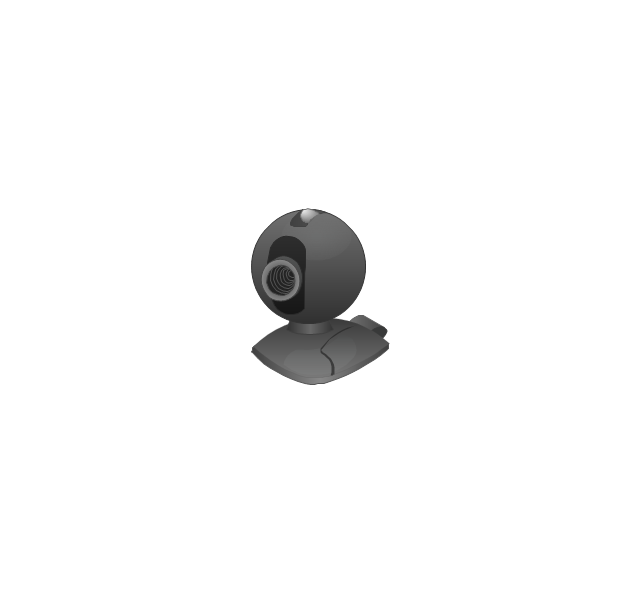
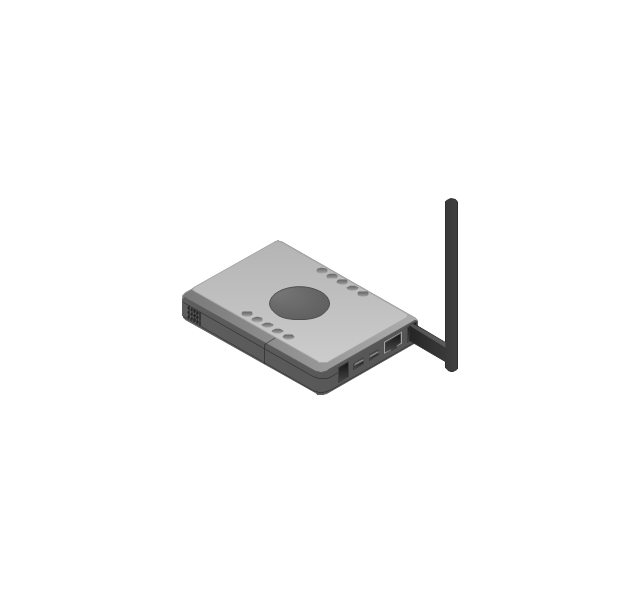
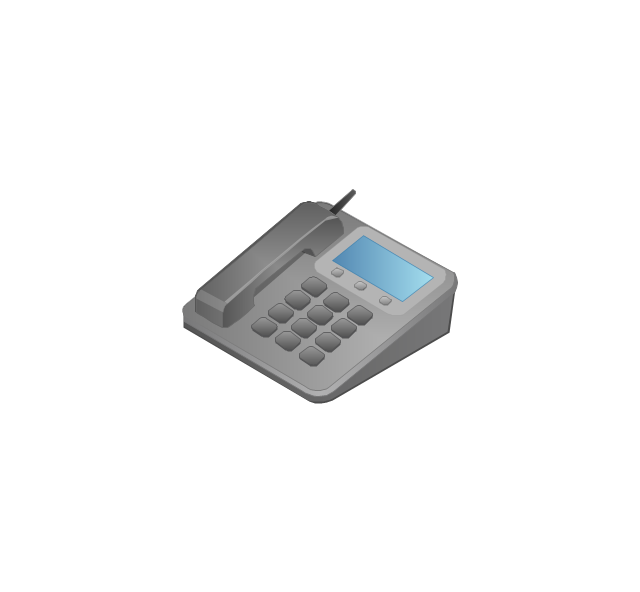
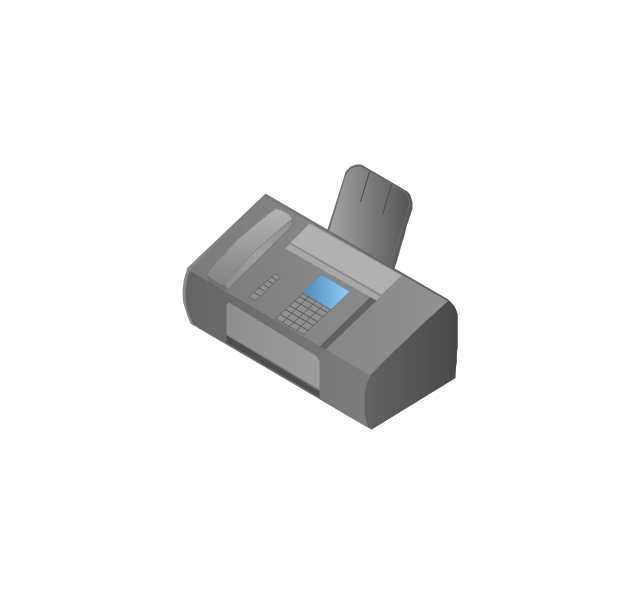
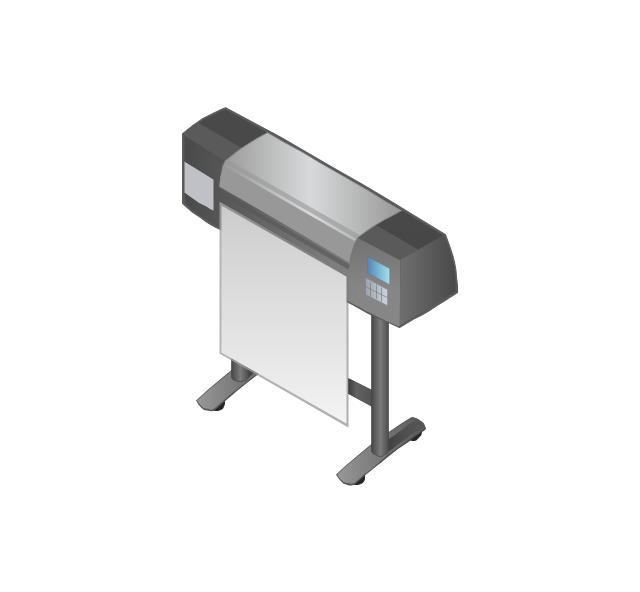
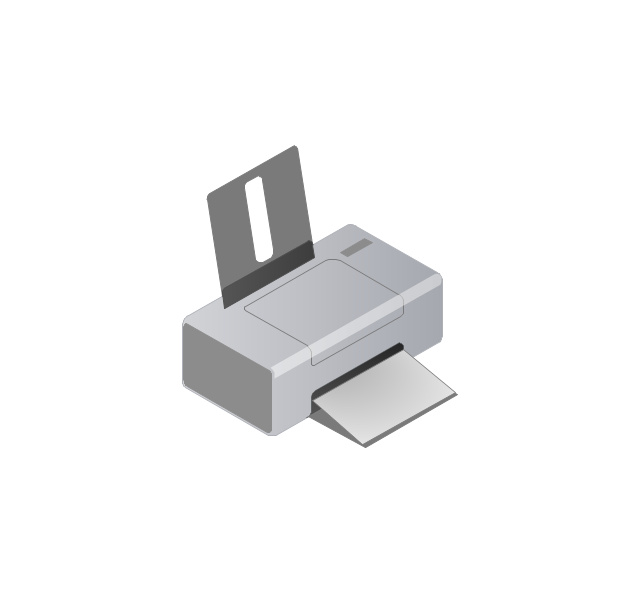
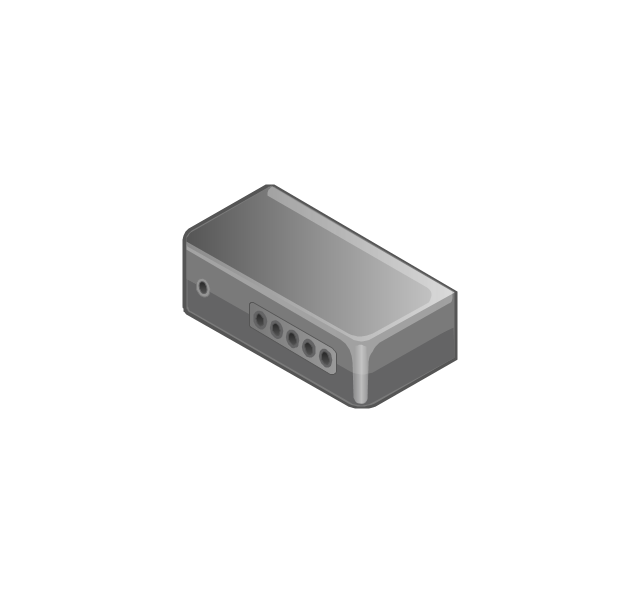
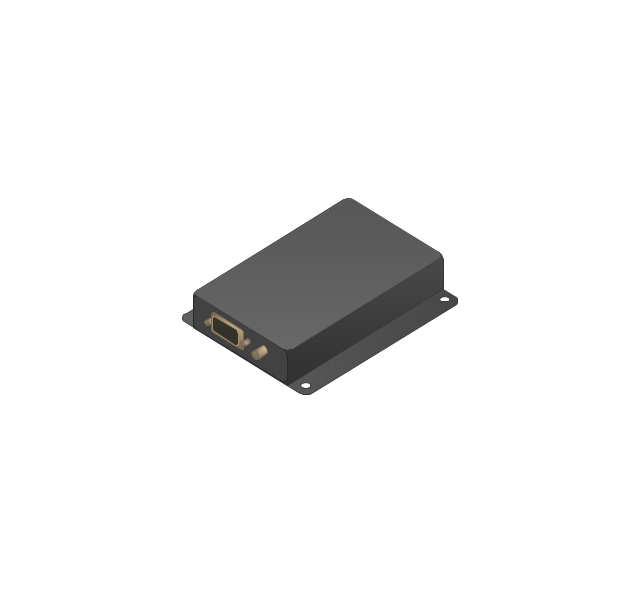
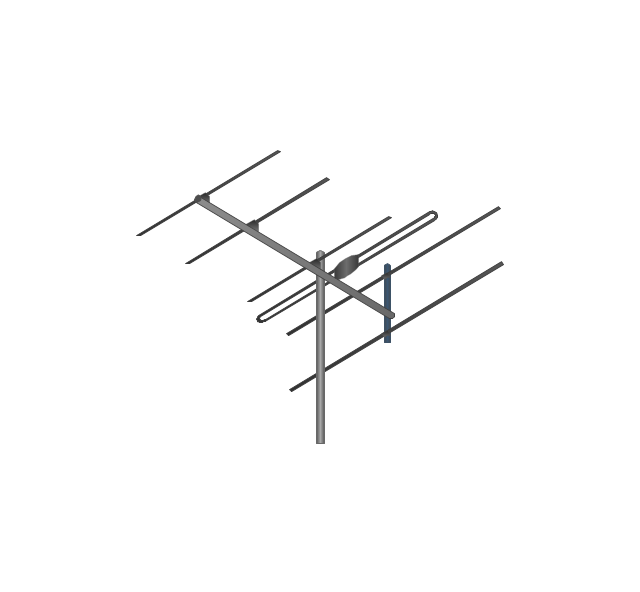
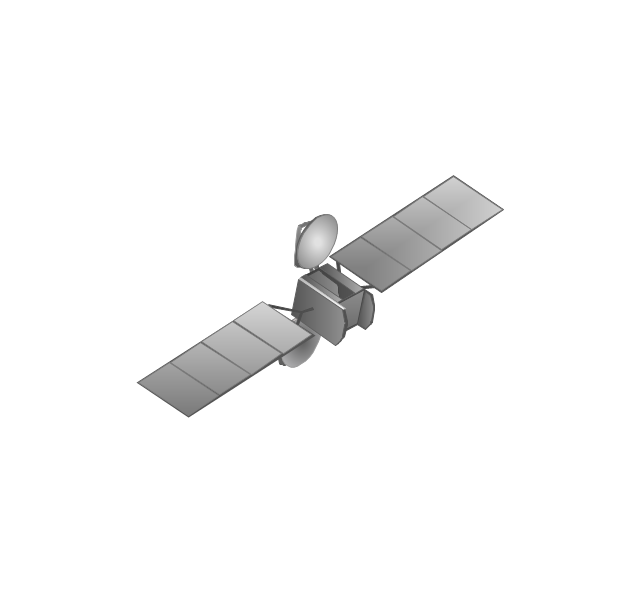
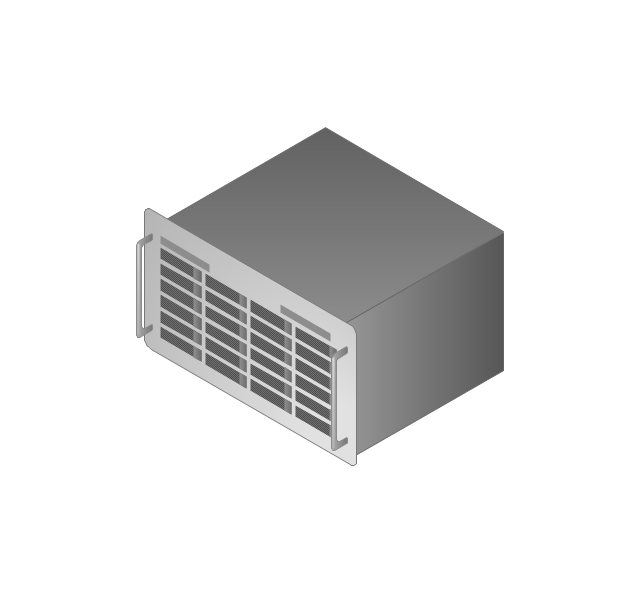
The vector stencils library "Computers and network isometric" contains 56 3D clipart images of computer and network devices and equipment for drawing network diagrams.
The clip art example "Computers and network isometric - Vector stencils library" was created using the ConceptDraw PRO diagramming and vector drawing software extended with the Computer and Networks solution from the Computer and Networks area of ConceptDraw Solution Park.
The clip art example "Computers and network isometric - Vector stencils library" was created using the ConceptDraw PRO diagramming and vector drawing software extended with the Computer and Networks solution from the Computer and Networks area of ConceptDraw Solution Park.
Laptop
DDCS

Server
Webcam
Wireless Network Storage
Personal computer

VoIP phone
Fax
Plotter
Mobile phone
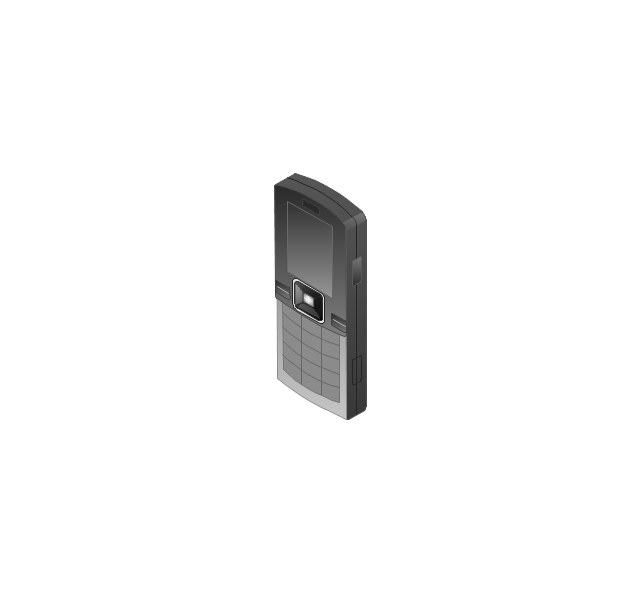
Feature phone

Printer
Satellite dish

Satellite antenna
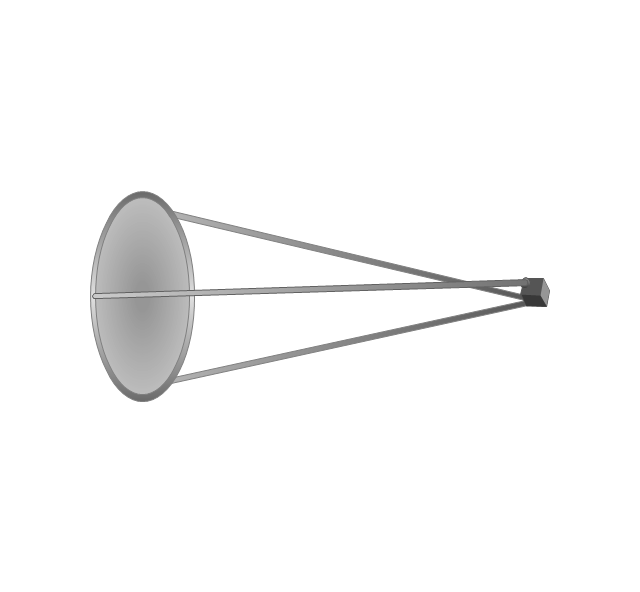
Automatic-tracking satellite dish
Wireless access point
Wireless router
Router
Network switch
Network device
Mobile GPS Terminal
GPS phone

Television antenna
Radio tower

Base station

Satellite
In-vehicle satellite telecommunication

Satellite dishes on ship

Airplane

Internet

Man

Woman

Call-center

Honeycomb

Mountain

Radio waves

Radio waves

Tower block
Office building
House

House

Globe

Wireless security camera
Truck

Tree

Conifer tree

1U hub / switch
2U hub / switch
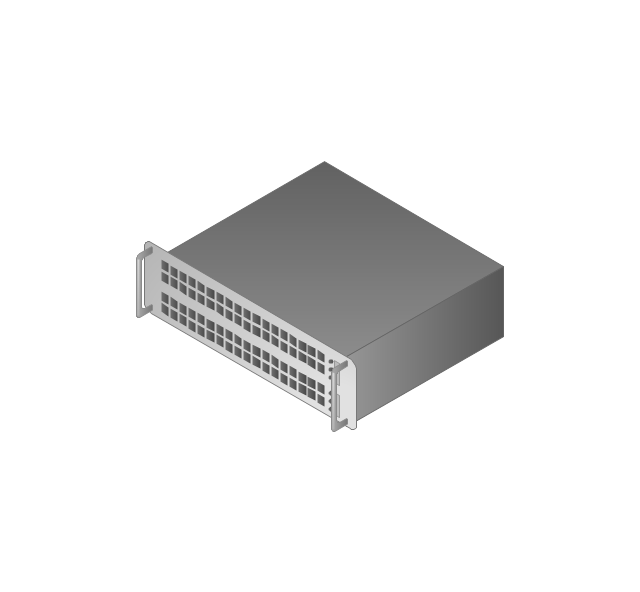
1U server

2U Server
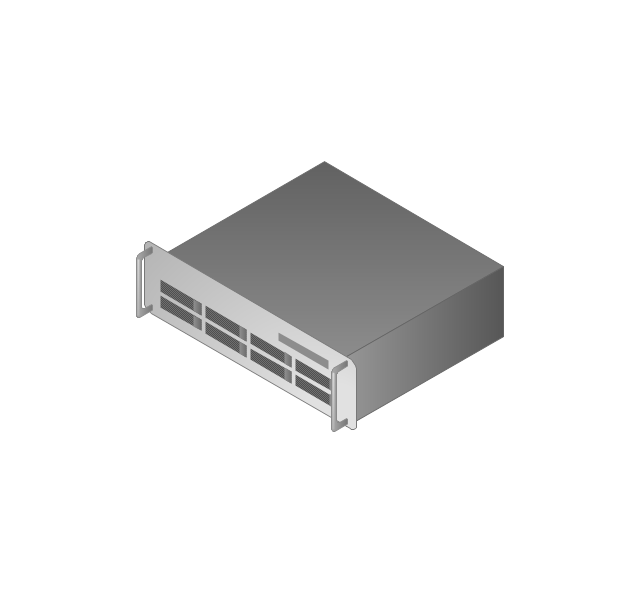
3U Server
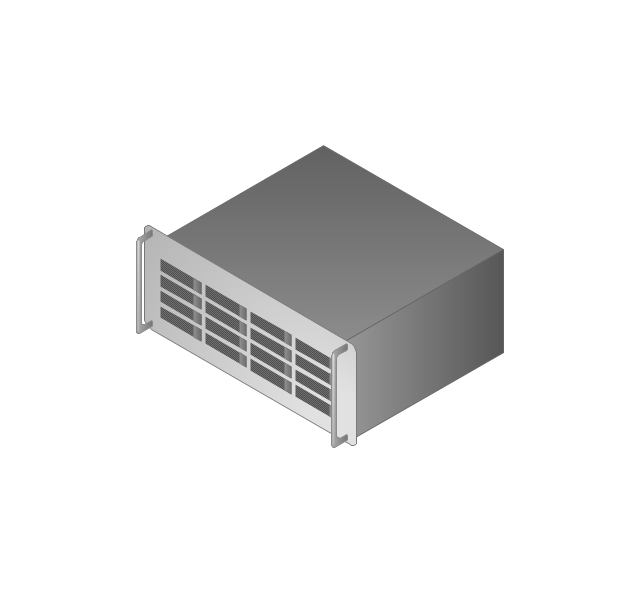
4U Server
Communications satellite

Car
Radio waves

Firewall

The vector stencils library "Education pictograms" contains 128 education pictograms. Use this flat icon set to design your educational infogram in ConceptDraw PRO diagramming and vector drawing software.
The vector stencils library "Education pictograms" is included in the Education Infographics solution from the Business Infographics area of ConceptDraw Solution Park.
The vector stencils library "Education pictograms" is included in the Education Infographics solution from the Business Infographics area of ConceptDraw Solution Park.
ABC
Apple
Artist oil colors
Artists paint palette
Atom
Baseball
Basketball
Beaker
Bell
Bicycle
Book - open
Books
Brushes
Bunsen burner
Calculator
Calendar
CD
Cell model
Chemical flask
Cloud
Colored paper
Colored pencils
Compass
Compasses
Dinosaur skeleton
Diploma
DNA double helix
Drop
Dumbbells
Earth
Earth's internal structure
Easel
Email
Eraser
Exercise book
Felt tip pens
Folders
Football
Funnel
Gears
Globe
Gouache
Graduation cap
Grand piano
Grand piano - clipart
Green blackboard
Hourglass
Laptop
Laptop mouse
Light bulb
Magnet
Magnifier
Marker - black
Marker - blue
Marker - green
Marker - red
Marker - white
Marker - yellow
Medal with ribbon
Metronome
Microscope
Moon
Music notes
Notebook
Notepad
Paper clips
Paper sheet
Paper sheet - grid
Paper sheet - lined
Paper stickers
Parthenon
Pen
Pen - fountain
Pencil
Periodic table
Protractor
Push pins
Robot
Round bottom flask
Rugby ball
Ruler
Scales
School backpack
School bus
School satchel
Schoolboy - african
Schoolboy - asian
Schoolboy - caucasian
Schoolboy - indian
Schoolgirl - african
Schoolgirl - asian
Schoolgirl - caucasian
Schoolgirl - indian
Scissors and a bottle of glue
Scroll
Snowflake
Sport cup
Star
Stickers
Stopwatch
Sun
Tablet computer
Teacher with a pointer
Teacher - african
Teacher - asian
Teacher - caucasian
Teacher - indian
Teacher - woman, african
Teacher - woman, asian
Teacher - woman, caucasian
Teacher - woman, indian
Telescope
Test tube
Thermometer
To-Do list
Tree leaf - acacia
Tree leaf - birch
Tree leaf - chestnut
Tree leaf - maple
Tree leaf - oak
Tree leaf - walnut
Triangle ruler
Volleyball
Violin
Violin - clipart
Wall clock
Watercolor set
World map
The vector stencils library "Telecommunication networks" contains 32 clipart images of telecommunication network devices and equipment for drawing telecom network diagrams.
"A telecommunications network is a collection of terminal nodes, links and any intermediate nodes which are connected so as to enable telecommunication between the terminals.
The transmission links connect the nodes together. The nodes use circuit switching, message switching or packet switching to pass the signal through the correct links and nodes to reach the correct destination terminal.
Each terminal in the network usually has a unique address so messages or connections can be routed to the correct recipients. The collection of addresses in the network is called the address space." [Telecommunications network. Wikipedia]
The clip art example "Telecommunication networks - Vector stencils library" was created using the ConceptDraw PRO diagramming and vector drawing software extended with the Telecommunication Network Diagrams solution from the Computer and Networks area of ConceptDraw Solution Park.
Internet

Globe

Base station

Satellite dish

Satellite dish

Communications satellite

Wireless cell tower

Radio waves

Radio waves

Cellular phone
Server

Laptop computer

Desktop computer

Car

Satellite truck

House

House

Office building

Mountain

Tree

Tree

User

Call-center

Multi-storey

Antenna

Router

IP phone

Fax
Network cell

IP Camera

Wireless router

Networking device
The vector stencils library "Computers" contains 52 computer hardware icons.
Use it to design your audio, video and multimedia illustrations, presentations, web pages and infographics with ConceptDraw PRO diagramming and vector drawing software.
"Computer hardware (or simply hardware in computing contexts) is the collection of physical elements that constitutes a computer system. Computer hardware is the physical parts or components of a computer, such as the monitor, keyboard, computer data storage, hard disk drive (HDD), graphic cards, sound cards, memory (RAM), motherboard, and so on, all of which are tangible physical objects." [Computer hardware. Wikipedia]
The clipart example "Computers" is included in the Audio, Video, Media solution from the Illustrations area of ConceptDraw Solution Park.
Multimedia clipart
The vector stencils library "Education pictograms" contains 128 education pictograms. Use this flat icon set to design your educational infogram in ConceptDraw PRO diagramming and vector drawing software.
The vector stencils library "Education pictograms" is included in the Education Infographics solution from the Business Infographics area of ConceptDraw Solution Park.
The vector stencils library "Education pictograms" is included in the Education Infographics solution from the Business Infographics area of ConceptDraw Solution Park.
ABC
Apple
Artist oil colors
Artists paint palette
Atom
Baseball
Basketball
Beaker
Bell
Bicycle
Book - open
Books
Brushes
Bunsen burner
Calculator
Calendar
CD
Cell model
Chemical flask
Cloud
Colored paper
Colored pencils
Compass
Compasses
Dinosaur skeleton
Diploma
DNA double helix
Drop
Dumbbells
Earth
Earth's internal structure
Easel
Email
Eraser
Exercise book
Felt tip pens
Folders
Football
Funnel
Gears
Globe
Gouache
Graduation cap
Grand piano
Grand piano - clipart
Green blackboard
Hourglass
Laptop
Laptop mouse
Light bulb
Magnet
Magnifier
Marker - black
Marker - blue
Marker - green
Marker - red
Marker - white
Marker - yellow
Medal with ribbon
Metronome
Microscope
Moon
Music notes
Notebook
Notepad
Paper clips
Paper sheet
Paper sheet - grid
Paper sheet - lined
Paper stickers
Parthenon
Pen
Pen - fountain
Pencil
Periodic table
Protractor
Push pins
Robot
Round bottom flask
Rugby ball
Ruler
Scales
School backpack
School bus
School satchel
Schoolboy - african
Schoolboy - asian
Schoolboy - caucasian
Schoolboy - indian
Schoolgirl - african
Schoolgirl - asian
Schoolgirl - caucasian
Schoolgirl - indian
Scissors and a bottle of glue
Scroll
Snowflake
Sport cup
Star
Stickers
Stopwatch
Sun
Tablet computer
Teacher with a pointer
Teacher - african
Teacher - asian
Teacher - caucasian
Teacher - indian
Teacher - woman, african
Teacher - woman, asian
Teacher - woman, caucasian
Teacher - woman, indian
Telescope
Test tube
Thermometer
To-Do list
Tree leaf - acacia
Tree leaf - birch
Tree leaf - chestnut
Tree leaf - maple
Tree leaf - oak
Tree leaf - walnut
Triangle ruler
Volleyball
Violin
Violin - clipart
Wall clock
Watercolor set
World map
How To use House Electrical Plan Software


The vector stencils library "Scrum workspace" contains 21 icons.
Use this clipart set to design your agile software development diagrams and infographics with ConceptDraw PRO software.
"... a list of all the things that ... should be visible within the ideal agile workspace:
Big Visible Charts. ... the sprint burndown chart, showing the number of hours remaining as of each day of the current sprint. ... big visible charts showing the number of passing customer acceptance tests, the pass/ fail status of tests by day, sprint and release burndown charts, number of new stories introduced to the product backlog per sprint, and more.
Additional feedback devices. In addition to big, visible charts, it is common for an agile team to use additional visual feedback devices in their workspace. One of the most common is a lava lamp that is turned on whenever the automated build is broken.
... flashing red traffic lights to indicate exceptional conditions such as an issue on a production server. Also popular are ambient orbs and Nabaztag rabbits, which are wireless programmable devices that can also be configured to change colors, speak messages, or wiggle their ears as a team desires. ...
Everyone on your team. Each person on the team should ideally be able to see each other person on the team. This absolutely includes the ScrumMaster and ideally includes the product owner. ...
The sprint backlog. One of the best ways to ensure that everything necessary is completed in the sprint is to make the sprint backlog visible. The best way to do that is by displaying the sprint backlog on a wall, ideally in the form of a task board ...
The product backlog. One problem with running an endless series of sprints is that each can feel disconnected or isolated from the whole of a planned released or related set of new capabilities. A good way to reduce the impact of this problem is by displaying the product backlog somewhere clearly visible. ... tack the index cards with those upcoming user stories on a wall where all can see them. This allows team members to see how the user stories they are working on in the current sprint relate to others that are coming soon.
At least one big white board. ... Locating this in the team’s common workspace encourages spontaneous meetings." [mountaingoatsoftware.com/ blog/ the-ideal-agile-workspace]
The clip art sample "Design elements - Scrum workspace" is included in the Scrum solution from the Project Management area of ConceptDraw Solution Park.
Icon set
- Cloud clipart - Vector stencils library
- Business People Clipart | Office - Design Elements | Design ...
- Office Design Element | Grand piano - clipart | Geo Map - Asia | Paint ...
- How to Add a Mind Map into a Given Notebook in Your Evernote ...
- Png Of Winner Cup Clipart
- Educational Clip Art
- Clipart School | CCTV Network Example | Design elements ...
- Clipart School | Geo Map - USA - Wisconsin | School and Training ...
- Presentation Clipart | Education pictograms - Vector stencils library ...
- Winner Clipart Png
- Presentation Clipart | Road Transport - Design Elements | How to ...
- People - Vector stencils library | Business people clipart - Vector ...
- Communication Clipart
- Design elements - Android system icons (file) | Cloud clipart - Vector ...
- Presentation design elements - Vector clipart library | Design ...
- Design elements - Cybersecurity clipart | Design elements ...
- Design elements - Tools | Cloud clipart - Vector stencils library ...
- Clipart Drawing Of Teacher
- Earthquake disaster assessment - Workflow diagram | Cloud clipart ...
- Aerospace and Transport | Cloud clipart - Vector stencils library ...