This hexagon diagram sample was redesigned from the Wikipedia file: Virtuous circle in macroeconomics.svg. "An example of the use of a virtuous circle in macroeconomics."
[en.wikipedia.org/ wiki/ File:Virtuous_ circle_ in_ macroeconomics.svg]
"A virtuous circle and a vicious circle (also referred to as virtuous cycle and vicious cycle) are economic terms. They refer to a complex chain of events that reinforces itself through a feedback loop. A virtuous circle has favorable results, while a vicious circle has detrimental results.
Both circles are complexes of events with no tendency towards equilibrium (at least in the short run). Both systems of events have feedback loops in which each iteration of the cycle reinforces the previous one (positive feedback). These cycles will continue in the direction of their momentum until an external factor intervenes and breaks the cycle. The prefix "hyper-" is sometimes used to describe these cycles if they are extreme. The best-known example of a vicious circle is hyperinflation. ...
Example in macroeconomics.
Virtuous circle.
Economic growth can be seen as a virtuous circle. It might start with an exogenous factor such as technological innovation. As people get familiar with the new technology, there could be learning curve effects and economies of scale. This could lead to reduced costs and improved production efficiencies. In a competitive market structure, this will probably result in lower average prices or a decrease in employment as it takes fewer workers to produce the same output. As prices decrease, consumption could increase and aggregate output also. Increased levels of output lead to more learning and scale effects and a new cycle starts."
[en.wikipedia.org/ wiki/ Virtuous_ circle_ and_ vicious_ circle]
The crystal diagram example "Virtuous circle (macroeconomics)" was created using the ConceptDraw PRO diagramming and vector drawing software extended with the Target and Circular Diagrams solution from the Marketing area of ConceptDraw Solution Park.
www.conceptdraw.com/ solution-park/ marketing-target-and-circular-diagrams
Hexagon diagram
---crystal-diagram.png--diagram-flowchart-example.png)
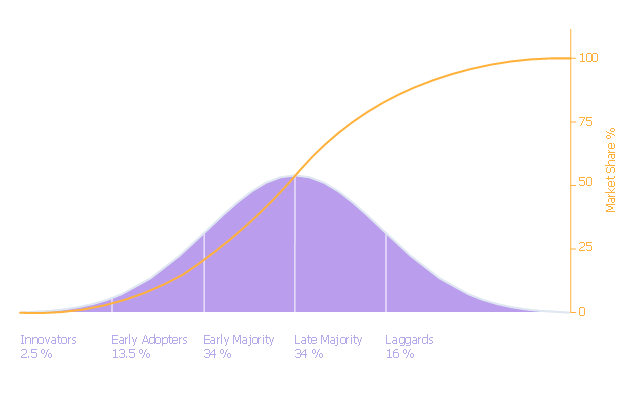
Diffusion of innovations (DOI) graph illustrates the diffusion of innovations theory.
"Diffusion of innovations is a theory that seeks to explain how, why, and at what rate new ideas and technology spread through cultures. Everett Rogers, a professor of communication studies, popularized the theory in his book Diffusion of Innovations... The book says that diffusion is the process by which an innovation is communicated through certain channels over time among the members of a social system. ... The book espouses the theory that there are four main elements that influence the spread of a new idea: the innovation, communication channels, time, and a social system. This process relies heavily on human capital. The innovation must be widely adopted in order to self-sustain. Within the rate of adoption, there is a point at which an innovation reaches critical mass. The categories of adopters are: innovators, early adopters, early majority, late majority, and laggards ... Diffusion of Innovations manifests itself in different ways in various cultures and fields and is highly subject to the type of adopters and innovation-decision process." [Diffusion of innovations. Wikipedia]
The marketing chart example "Diffusion of innovations graph" was created using the ConceptDraw PRO diagramming and vector drawing software extended with the Marketing Diagrams solution from the Marketing area of ConceptDraw Solution Park.
Marketing chart
SWOT Analysis

 Marketing Diagrams
Marketing Diagrams solution extends ConceptDraw DIAGRAM diagramming software with abundance of samples, templates and vector design elements intended for easy graphical visualization and drawing different types of Marketing diagrams and graphs, including Branding Strategies Diagram, Five Forces Model Diagram, Decision Tree Diagram, Puzzle Diagram, Step Diagram, Process Chart, Strategy Map, Funnel Diagram, Value Chain Diagram, Ladder of Customer Loyalty Diagram, Leaky Bucket Diagram, Promotional Mix Diagram, Service-Goods Continuum Diagram, Six Markets Model Diagram, Sources of Customer Satisfaction Diagram, etc. Analyze effectively the marketing activity of your company and apply the optimal marketing methods with ConceptDraw DIAGRAM software.
How To Draw a Diagram
Genomics
 Windows 10 User Interface
Windows 10 User Interface solution extends significantly ConceptDraw DIAGRAM functionality with look-and-feel functions of GUI software and makes it a great assistant for Win10 designers, developers, and software engineers. This solution provides a wide s
 Computer and Networks Area
The solutions from Computer and Networks Area of ConceptDraw Solution Park collect samples, templates and vector stencils libraries for drawing computer and network diagrams, schemes and technical drawings.
 Workflow Diagrams
Workflow Diagrams solution extends ConceptDraw DIAGRAM software with samples, templates and vector stencils library for drawing the work process flowcharts.
Biomedical Technology
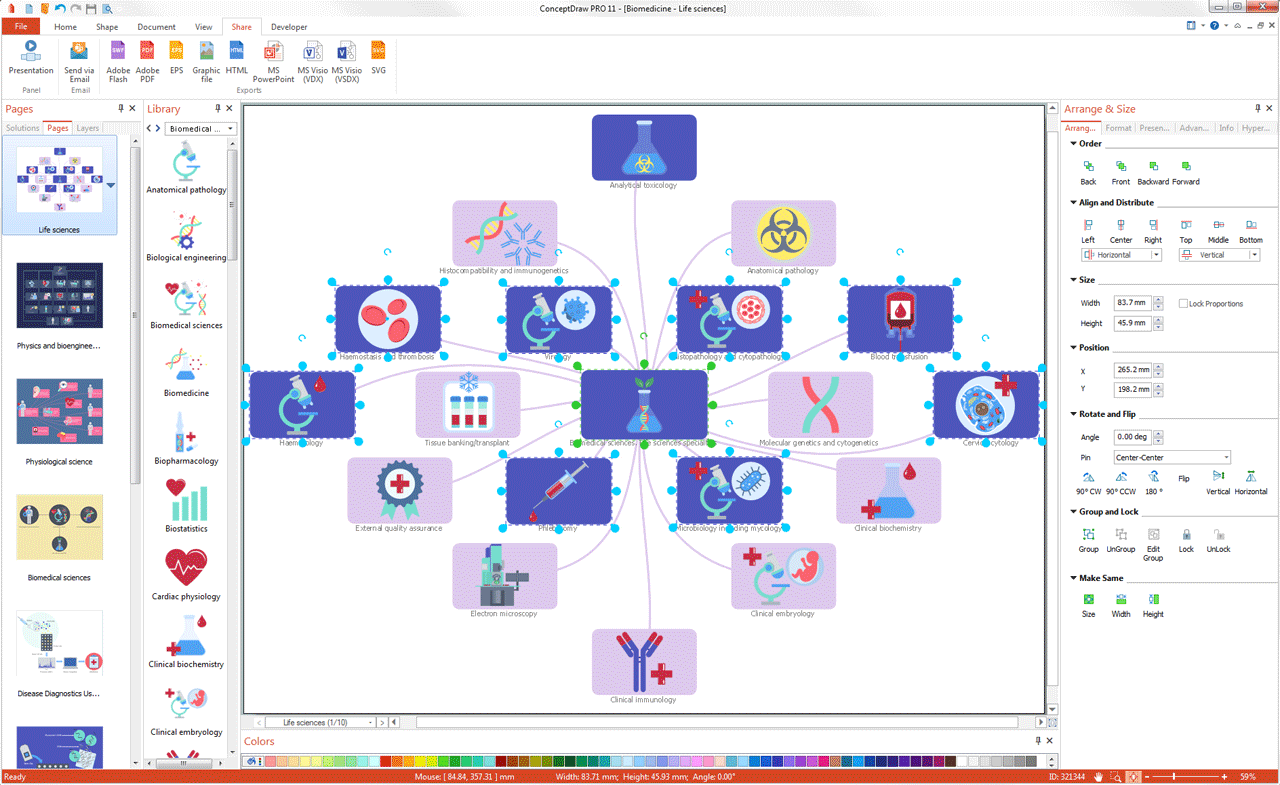
Choosing any needed from 137 vector graphics icons from the Biomedicine solution may simplify the work of creating the great looking as well as smart and professional looking drawings within only a few minutes. Being based on the already previously created examples of the biomedical-related drawings, any ConceptDraw DIAGRAM user can make the unique ones getting a smart looking result.
- Diagrams On Innovation
- Life Cycle Of Innovation
- Research cycle - Circle diagram | Innovation life cycle - Arrow loop ...
- Diagram Innovation Loop
- Research cycle - Circle diagram | Innovation life cycle - Arrow loop ...
- Innovation life cycle - Arrow loop diagram | Target and Circular ...
- Diffusion of innovations graph | Marketing Diagrams | Marketing ...
- Proton-proton chain reaction diagram | BPR Diagram. Business ...
- Research cycle - Circle diagram | Innovation life cycle - Arrow loop ...
- Innovation life cycle - Arrow loop diagram | Drawing Illustration ...