Competitor Analysis
Competitor analysis is a first and obligatory step in elaboration the proper corporate marketing strategy and creating sustainable competitive advantage. Use powerful opportunities of numerous solutions from ConceptDraw Solution Park for designing illustrative diagrams, charts, matrices which are necessary for effective competitor analysis.Flow Chart Online
Flow Chart is a great visualization tool for the flow of a process, algorithm or procedure with a lot of benefits. It is convenient to use a powerful software for creating flow charts. Now we have the best flow chart maker online design software - ConceptDraw DIAGRAM enhanced with Flowcharts Solution from the "Diagrams" Area of ConceptDraw Solution Park.Basic Diagramming
ConceptDraw DIAGRAM with the specific tools you need to easily draw flowcharts, block diagrams, bar charts, histograms, pie charts, divided bar diagrams, line graphs, area charts, scatter plots, circular arrows diagrams, Venn diagrams, bubble diagrams, concept maps, electrical circuit diagrams, schematics,and others.Use Basic Diagramming solution to draw you own diagrams, charts and graphs for graphic communication, explanation of business and personal ideas and concepts, simple visual presentation of numerical data, complex structures, logical relations, step-by-step flows of actions or operations.
Block Diagrams
Block diagrams solution extends ConceptDraw DIAGRAM software with templates, samples and libraries of vector stencils for drawing the block diagrams.
HelpDesk
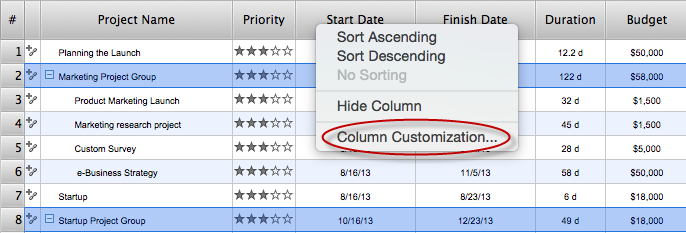
What Information can be Displayed in the Multiproject Dashboard View
The columns in a Multiproject Dashboard tab of ConceptDraw PROJECT determine what information you want to capture on each project. It’s important to make sure you have the correct columns available. This article describes information that multiple projects list can contain.HelpDesk
What Information to be Displayed in the ConceptDraw PROJECT Gantt Chart View
What information can can contain the project task list? Gantt Chart view is a graphical representation of a project outline that allows one to allocate tasks.You can customize a project’s tasks list view to include the columns you need to meet your information requirements. The columns of the ConceptDraw PROJECT Gantt view contain the information you want to capture about each task in your project. The following article details what information can be contained in the columns of a project outline.- Micro Diagram
- Target diagrams - Vector stencils library | Target diagrams - Vector ...
- Marketing Diagrams | Marketing Analysis Diagram | Flowchart ...
- Total value of manufacturers' shipments - Arrow graph | Design ...
- Circle-spoke diagram - Target market | Target diagrams - Vector ...
- Design elements - Target diagrams | A framework for understanding ...
- Circle-spoke diagram - Target market
- Micro Office Word
- Process Flowchart | Information systems in the schools | Design ...
- Porter's Value Chain | Block diagram - Porter's five forces model ...
- Design elements - Analog and digital logic | Electrical Symbols ...
- Line Chart Templates | The increse in subscibers on YouTube to ...
- Target And Circular Diagrams Solution
- Examples Of Input Devices Of Computer
- Marketing mix - Wheel diagram
- Block Diagrams
- Bar Graphs | Cross-Functional Flowchart | Flow chart Example ...
- External digital devices - Vector stencils library | Design elements ...
- How to Export Project Data to MS Excel Worksheet | How to ...
- Network Diagrams for Bandwidth Management | Home area ...
- ERD | Entity Relationship Diagrams, ERD Software for Mac and Win
- Flowchart | Basic Flowchart Symbols and Meaning
- Flowchart | Flowchart Design - Symbols, Shapes, Stencils and Icons
- Flowchart | Flow Chart Symbols
- Electrical | Electrical Drawing - Wiring and Circuits Schematics
- Flowchart | Common Flowchart Symbols