Swot Analysis Examples
SWOT analysis is an advanced plan making methodology for detection the Strengths and Weaknesses, Opportunities and Threats, that are involved in a project. SWOT analysis possesses a wide variety of real and potential applications and is a key part of any business planning and analysis. SWOT analysis uses as a visual tool the SWOT diagrams and SWOT matrices. ConceptDraw DIAGRAM software with SWOT and TOWS Matrix Diagrams solution provides a lot of SWOT analysis examples and samples, and also numerous collection of built-in SWOT templates, which will be the good start in your self-depending drawing and the perfect source of inspiration. You can always start to design your SWOT diagrams from the blank sheet using the included predesigned vector objects, but in many cases to save the time and efforts for SWOT diagramming would be preferable to use the ready example the most appropriate to your needs. Customizing the proposed SWOT diagrams you will achieve a great success in drawing SWOT matrices of any style and complexity.Business Tools Perceptual Mapping
This sample shows the Perceptual map. It was created in ConceptDraw DIAGRAM diagramming and vector drawing software using the Matrices Solution from the Marketing area of ConceptDraw Solution Park. Perception Mapping helps organizations measure and transform all aspects of their business, people and culture. Perception Mapping allows to represent the complex relationships graphically, helps identify potential problems of the organization and make the best decisions.Line Chart Template for Word
This sample was created in ConceptDraw DIAGRAM diagramming and vector drawing software using the Line Graphs Solution from Graphs and Charts area of ConceptDraw Solution Park. This sample shows the Line Chart of annual percentage change. The Line Chart allows you to clearly see the changes of data over the time.Integration Definition
Creation of various types of Integration DEFinition (IDEF) diagrams - IDEF0, IDEF1X, IDEF2, IDEF3 and many other is a sufficiently complex process that requires powerful automated tools. ConceptDraw DIAGRAM diagramming and vector drawing software offers you such tool - IDEF Business Process Diagrams solution from the Business Processes area of ConceptDraw Solution Park.Product Proposal Documents Expanded
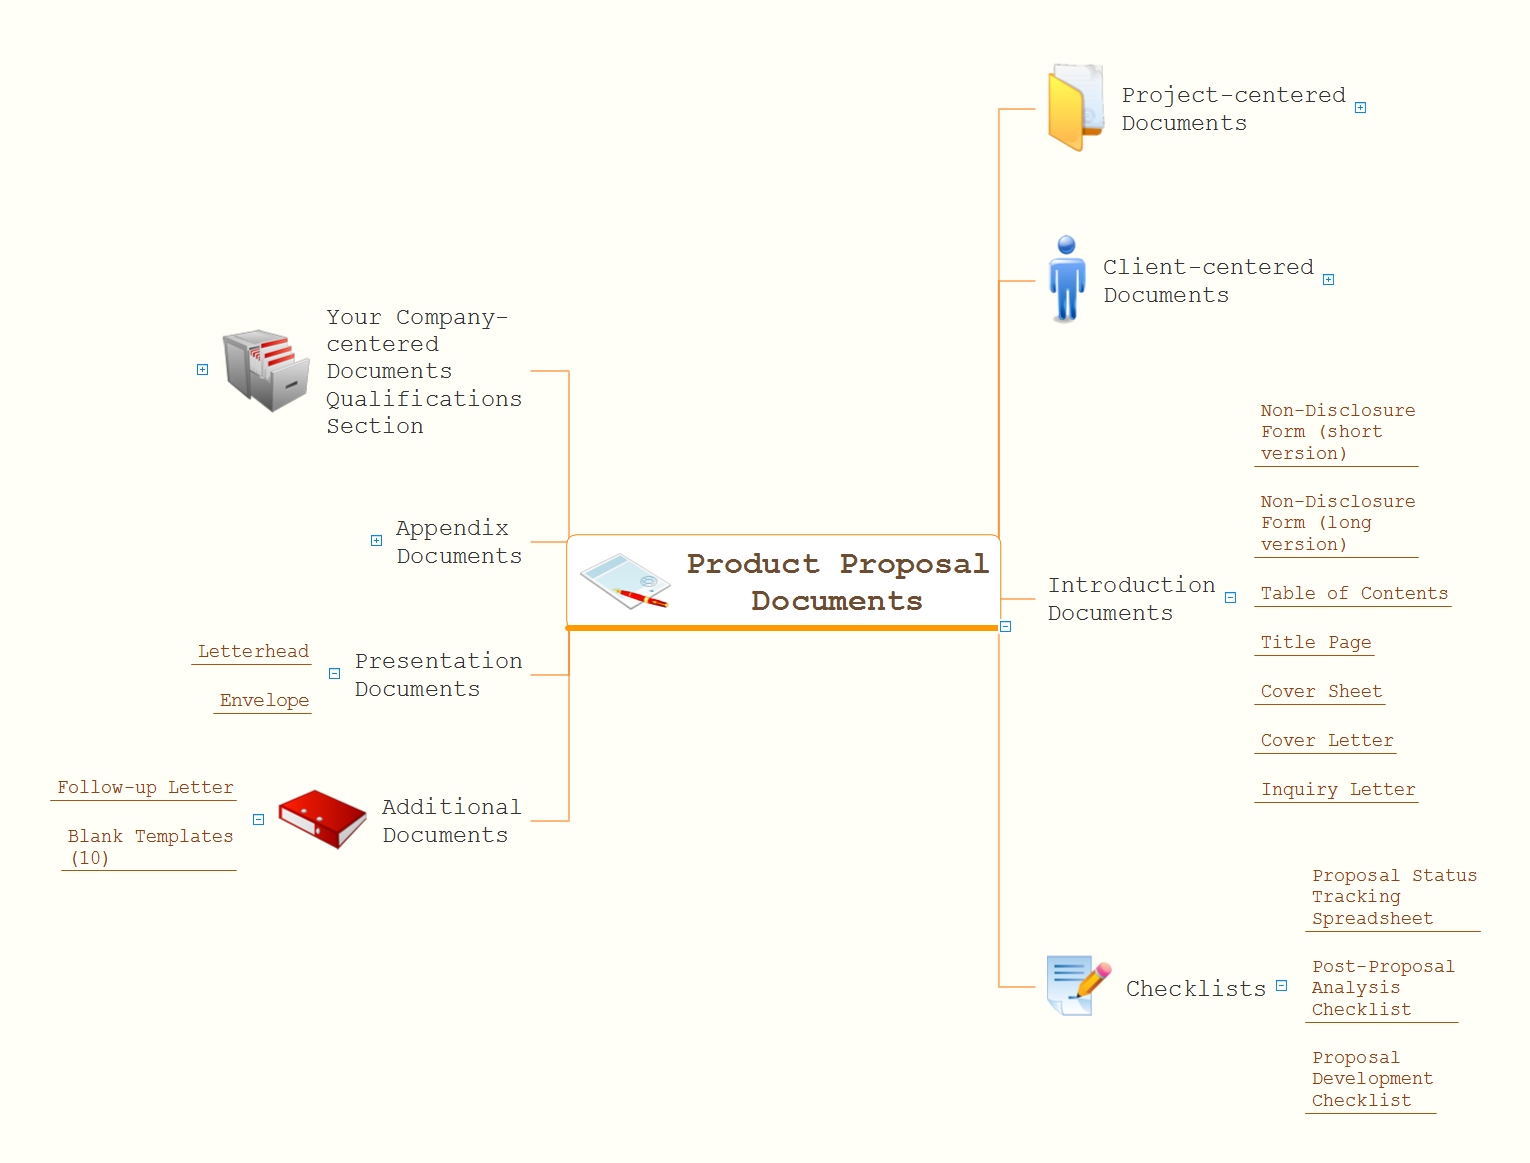
A product proposal is a defined list of offered products oriented on a specific customer. Often it is created during the processing of sales documents. The list of product proposal documents includes expanded set of documents for the products and also the sales documents. There are many ways to visually represent and structure the information and data. The Mind Map is one of them and furthemore one of the most successful and popular. Any Mind Map can be designed manually or with of specialized software, the ConceptDraw MINDMAP is the best software for easy brainstorming and designing professional-looking Mind Maps of any complexity, any size and any color style. This Mind Map created with help of useful tools of ConceptDraw MINDMAP application, demonstrates the power of this application and organizes on one diagram the documents required for a product proposal. The use of a Mind Map to illustrate this list is an ideal choice and perfect way to represent all details and don't miss anything.Donut Chart Templates
These donut chart templates was designed using ConceptDraw DIAGRAM diagramming and vector drawing software extended with Pie Charts solution from Graphs and Charts area of ConceptDraw Solution Park. All these donut chart templates are included in the Pie Charts solution. You can quickly rework these examples into your own charts by simply changing displayed data, title and legend texts.- Methods And Methodology Of Partnership Firm Project
- | Methodology Of Partnership Firm
- Methodology In Partnership Firm
- Pdf Of Methodology Of Partnership Firm Process And Procedue
- Partnershipfirm Methodology
- Methodology Of Partnership Firm Process And Procedure Project
- Methodology For Partnership Firm
- Partnership Firm Process And Procedure Project Methodology
- Procedure Of Registration Of Partnership Firm Methodology
- Partnership Firm Process And Procedure Methodology


