Technical Flow Chart

The vector stencils library "Dimensioning and tolerancing" contains 45 symbols of geometric dimensions and mechanical tolerances, geometric symbols, callouts, and text boxes and inserts.
Use these geometric dimensioning and tolerancing (GD&T) shapes to create annotated mechanical drawings in the ConceptDraw PRO diagramming and vector drawing software extended with the Mechanical Engineering solution from the Engineering area of ConceptDraw Solution Park.
www.conceptdraw.com/ solution-park/ engineering-mechanical
Datum (old)
-dimensioning-and-tolerancing---vector-stencils-library.png--diagram-flowchart-example.png)
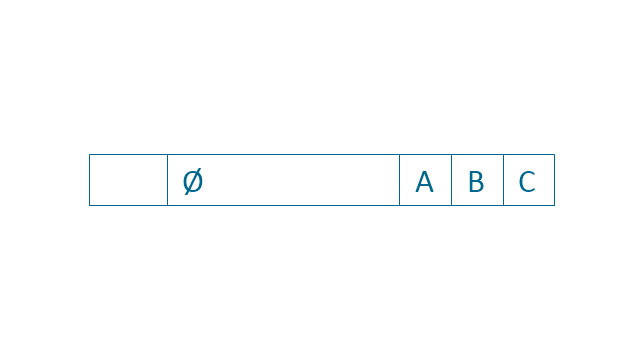
Box callout
Datum symbol
Callout

All around callout

Text block

2 datum frame
Simple frame

Basic frame

1 datum frame
3 datum frame
Straightness

Flatness

Line profile

Circularity

Cylindricity

Surface profile

Position

Concentricity

Symmetry

Parallelism

Perpendicularity
Angularity

Material condition

Arc length

Diameter

Counterbore/ spotface

Countersink

Depth

Slope
Conical taper
Statistical tolerance

Datum (new)
-dimensioning-and-tolerancing---vector-stencils-library.png--diagram-flowchart-example.png)
Datum (new) 2
-2-dimensioning-and-tolerancing---vector-stencils-library.png--diagram-flowchart-example.png)
Target point
Target line
Target area (circle)
-dimensioning-and-tolerancing---vector-stencils-library.png--diagram-flowchart-example.png)
Target area (rectangle)
-dimensioning-and-tolerancing---vector-stencils-library.png--diagram-flowchart-example.png)
Total runout

Total runout 2

Circular runout

Circular runout 2

Surface finish

Surface finish, removal process

Surface finish, no process permitted

 Business Processes Area
Solutions of Business Processes area extend ConceptDraw DIAGRAM software with samples, templates and vector stencils libraries for drawing business process diagrams and flowcharts for business process management.
Entity Relationship Software

 Entity-Relationship Diagram (ERD)
An Entity-Relationship Diagram (ERD) is a visual presentation of entities and relationships. That type of diagrams is often used in the semi-structured or unstructured data in databases and information systems. At first glance ERD is similar to a flowch
- Process Flowchart | Elements location of a welding symbol | Basic ...
- Basic Flowchart Symbols and Meaning | Process Flowchart ...
- Mechanical Drawing Symbols | Process Flowchart | Building ...
- Mechanical Drawing Symbols | UML Flowchart Symbols | Basic ...
- Mechanical Drawing Symbols | UML Flowchart Symbols | Design ...
- Various Symbols Used In Drawing
- Basic Flowchart Symbols and Meaning | Business Process ...
- Basic Flowchart Symbols and Meaning | Data Flow Diagram ...
- How to Draw Geometric Shapes in ConceptDraw PRO ...
- Symbols In Machine Design
- Mechanical Drawing Symbols | Technical Drawing Software ...
- Mechanical Drawing Symbols | Interior Design Machines and ...
- Mechanical Drawing Symbols | Interior Design Machines and ...
- Symbols Used In Mech Engg
- Symbol Of Machine
- Mechanical Drawing Symbols | Mechanical Engineering ...
- Mechanical Drawing Symbols | Technical Drawing Software | Basic ...
- Mechanical Drawing Symbols | Design elements - Dimensioning ...
- Basic Flowchart Symbols and Meaning | Flow Chart Symbols ...
- Mechanical Drawing Symbols | Mechanical Engineering ...