This site uses cookies. By continuing to browse the ConceptDraw site you are agreeing to our Use of Site Cookies.
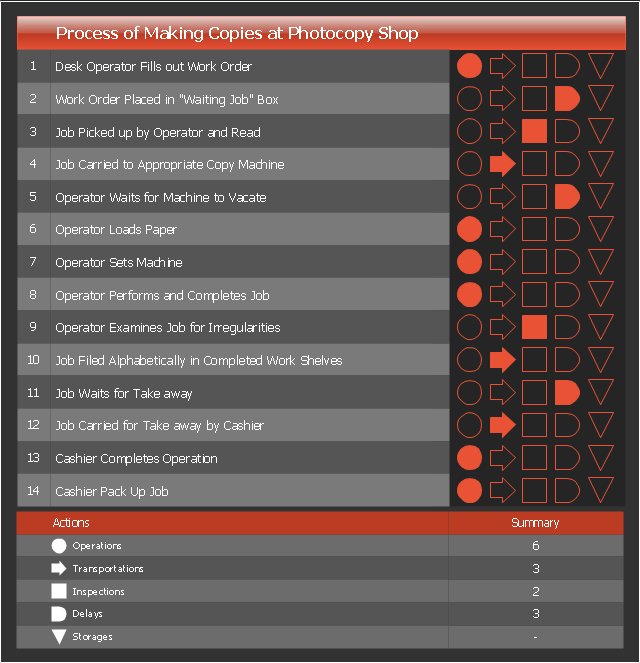
Flow process chart is used in quality control to display the action sequence of physical or manual process.
Flow process chart is useful for recording actions and documenting the production process.
Flow process chart helps to analyze and improve the process steps.
Flow process chart is more preferable than flowchart for documenting the mostly sequential processes.
Three types of flow process charts include: 1) man-type charts depicting the person actions, 2) material-type charts displaying the actions with product or material object, 3) equipment-type charts visualizing the useage of tools and equipment.
The set of symbols used in the flow process charts was developed by the American Society of Mechanical Engineers (ASME).
This flow process chart example was created using the ConceptDraw PRO diagramming and vector drawing software extended with the Matrices solution from the Marketing area of ConceptDraw Solution Park.
Flow process chart
Flow process chart, flow process chart,
Used Solutions

Types of Welding in Flowchart

This sample was created in ConceptDraw DIAGRAM diagramming and vector drawing software using the Flowcharts solution from the Diagrams area of ConceptDraw Solution Park.
This sample shows the Flowchart that displays the solid-state welding processes, the types of welding.

Flow Chart Symbols

Flowcharts are used in designing and documenting simple processes or programs. Like other types of diagrams, they help visualize what is going on and thereby help understand a process, and perhaps also find flaws, bottlenecks, and other less-obvious features within it. There are many different types of flowcharts, and each type has its own repertoire of boxes and notational conventions.
Flowchart diagrams consists of symbols of process, decision, data and document, data base, termination or initiation processes, processing loops and conditions. To create an drawn flowchart use professional flowchart maker of ConceptDraw DIAGRAM.

Activity Network Diagram Method

Activity Network Diagram - This sample was created in ConceptDraw DIAGRAM diagramming and vector drawing software using the Seven Management and Planning Tools solution from the Management area of ConceptDraw Solution Park.
This sample shows the PERT (Program Evaluation Review Technique) chart of the request on proposal. A request for proposal (RFP) is a request of the company or the organization to potential suppliers to submit the business proposals for service or goods that it is interested to purchase. The RFP is represented on the initial procurement stage and allows to define the risks and benefits.

Local area network (LAN). Computer and Network Examples

A local area network (LAN) is a devices network that connect with each other in the scope of a home, school, laboratory, or office. Usually, a LAN comprise computers and peripheral devices linked to a local domain server. All network appliances can use a shared printers or disk storage. A local area network serve for many hundreds of users. Typically, LAN includes many wires and cables that demand a previously designed network diagram. They are used by IT professionals to visually document the LANs physical structure and arrangement.
ConceptDraw - Perfect Network Diagramming Software with examples of LAN Diagrams. ConceptDraw Network Diagram is ideal for network engineers and network designers who need to draw Local Area Network diagrams.
How to Draw a Computer Network

How to Create a Pie Chart

Create a Pie Chart with ConceptDraw software quickly and easily. The simple tutorial helps you learn how to create a pie chart.

Star Network Topology

The Computer and Networks solution from Computer and Networks area of ConceptDraw Solution Park provides examples, templates and vector stencils library with symbols of local area network (LAN) and wireless LAN (WLAN) equipment.
Use it to draw the physical and logical network topology diagrams for wired and wireless computer communication networks.
Create Network Topology Diagram

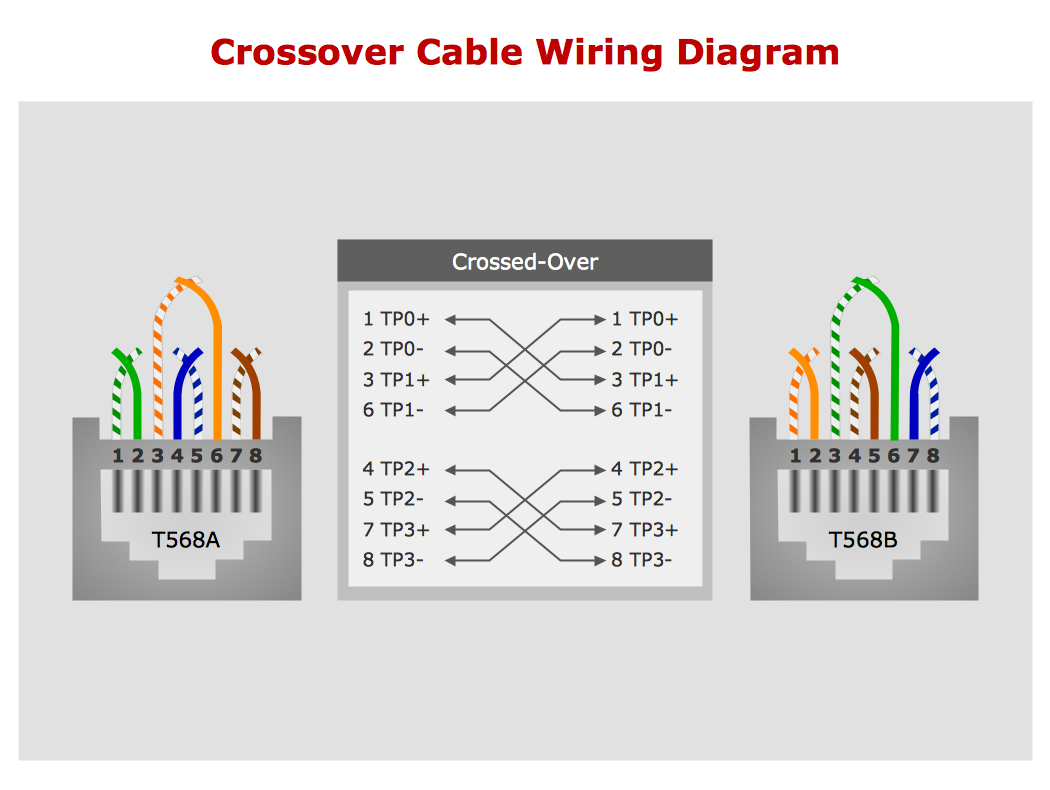
Network wiring cable. Computer and Network Examples

To connect two or more network devices are used the network cables. There are more different types of the network cables: Coaxial cable, Optical fiber cable, Twisted Pair, Ethernet crossover cable, Power lines and others. They are used depending of the network topology, size, protocol.
This example was created in ConceptDraw DIAGRAM using the Computer and Networks solution from the Computer and Networks area of ConceptDraw Solution Park.

Examples of Flowcharts, Org Charts and More

ConceptDraw examples covers a broad spectrum of business graphics categories. We separated all the graphic documents on application areas and had produced multiple solutions for each of them. ConceptDraw provides a wide variety of examples such as flowcharts, organizational charts, business charts, UML diagrams, database and ERD, directional map, network diagrams and lots more. Each solution accommodates 10+ examples that shows specific application cases of a diagram. ConceptDraw STORE is an application for downloading solutions with examples, templates and stencil libraries. Please choose any examples you are interested in, alternatively download them for free; you will need to install ConceptDraw to view them. As you will see, ConceptDraw is very powerful, you can use more than 10000 symbols, examples, and many pre-drawn templates, to create your own spectacular flowcharts, business diagrams, network diagrams and lots more, effortlessly, and in no time at all.
What is ConceptDraw OFFICE

What is the Accounting Cycle?

What is the accounting cycle? The accounting cycle is a sequence of steps that occur in the accounting period and include the processes of identifying, collecting, analyzing documents, recording transactions, classifying, summarizing, and reporting financial information of an organization.